Running a bakery involves managing multiple processes simultaneously—from tracking sales and production to monitoring inventory and staff performance. A Bakery KPI Dashboard in Google Sheets provides a ready-to-use solution to monitor key performance indicators (KPIs), analyze trends, and make data-driven decisions for better operational efficiency.
In this article, we will explain the features, benefits, best practices, and frequently asked questions about using this bakery KPI dashboard.
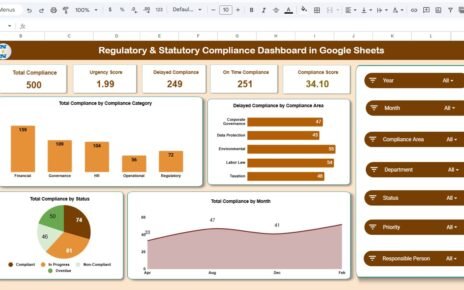
What Is a Bakery KPI Dashboard?
A Bakery KPI Dashboard is an interactive tool built in Google Sheets that consolidates bakery performance metrics in a single view. It helps bakery owners, managers, and analysts monitor sales, production efficiency, customer satisfaction, and operational KPIs.
With this dashboard, you can:
-
Track Month-to-Date (MTD) and Year-to-Date (YTD) metrics
-
Compare actual performance against targets and previous year values
-
Visualize trends for sales, production, and inventory
-
Make data-driven decisions to improve efficiency and profitability
Key Features of the Bakery KPI Dashboard
Click to Buy Bakery KPI Dashboard in Google Sheets
This dashboard includes 6 worksheets, each designed to provide detailed insights:
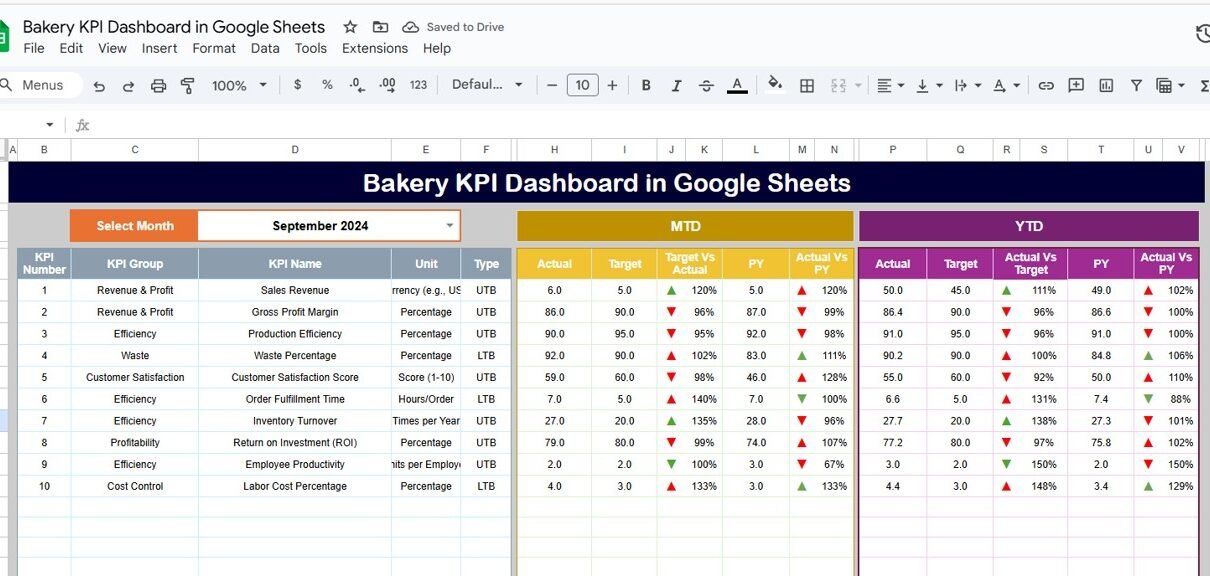
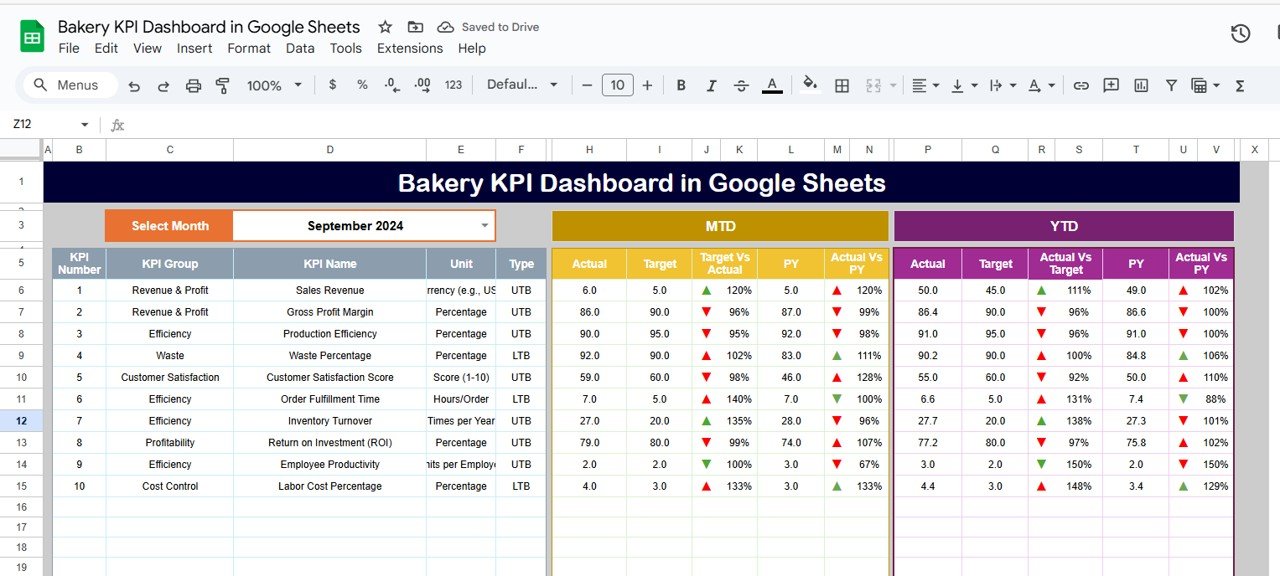
1. Dashboard Sheet Tab
The Dashboard Sheet provides an overview of all bakery KPIs:
-
Month Selection Dropdown (Range D3): Automatically updates all dashboard numbers for the selected month
-
MTD Metrics: Displays actual, target, and previous year values with conditional formatting arrows for quick insights
-
YTD Metrics: Provides cumulative performance metrics with visual indicators
Charts and visualizations on this sheet help monitor KPIs like sales, production, and customer satisfaction in one glance.
Click to Buy Bakery KPI Dashboard in Google Sheets
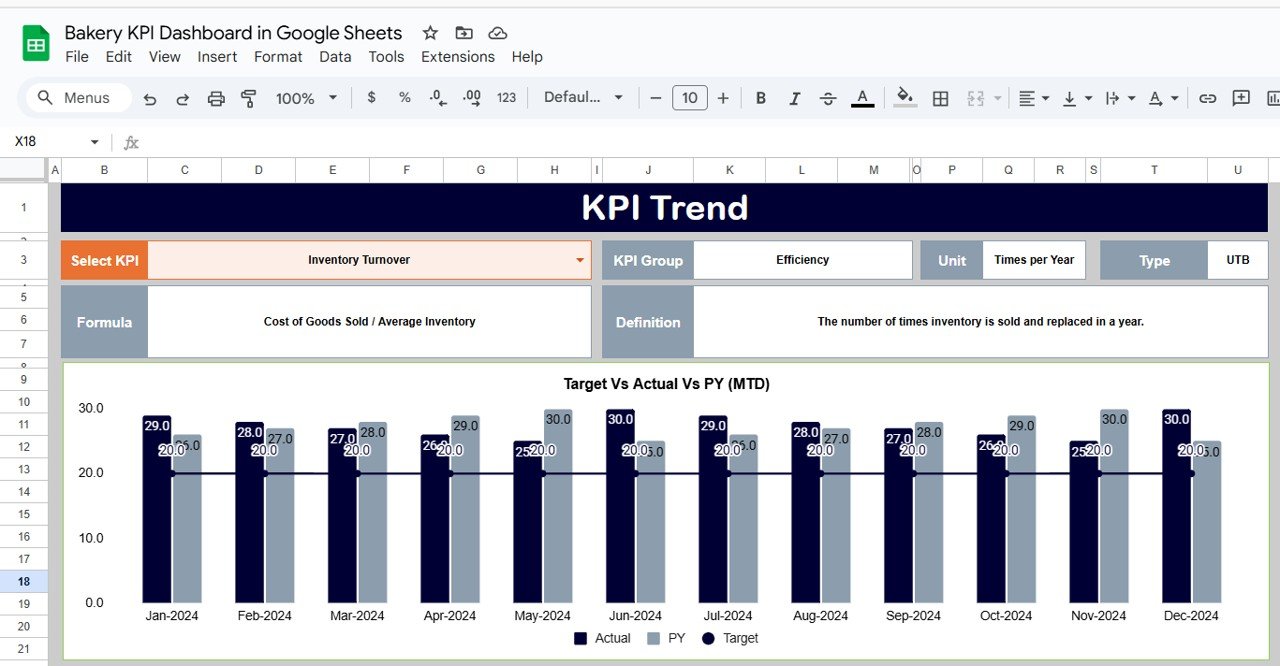
2. KPI Trend Sheet Tab
The KPI Trend Sheet provides a detailed view of each KPI:
-
Select the KPI from the dropdown (Range C3)
-
Displays KPI group, unit, and type (Upper-the-Better or Lower-the-Better)
-
Shows formula and KPI definition
-
Visualizes KPI trends over time for performance analysis
This sheet allows bakery managers to identify areas of improvement and track historical performance.
Click to Buy Bakery KPI Dashboard in Google Sheets
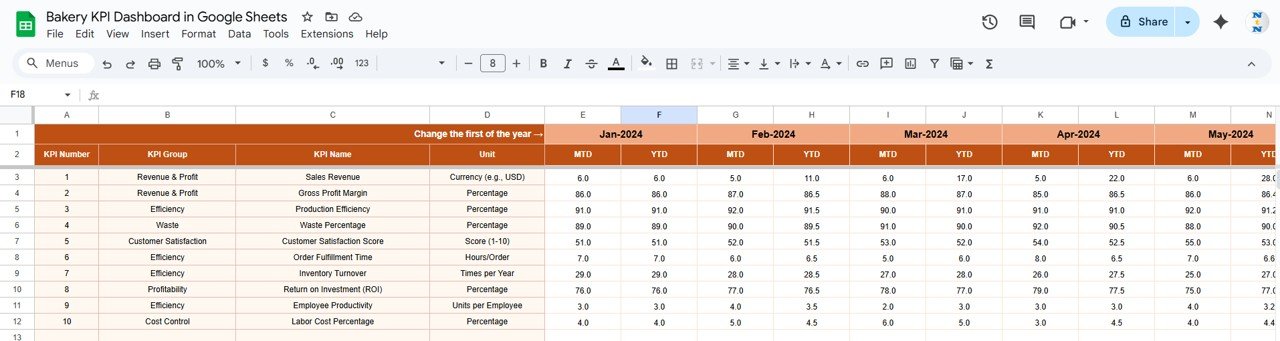
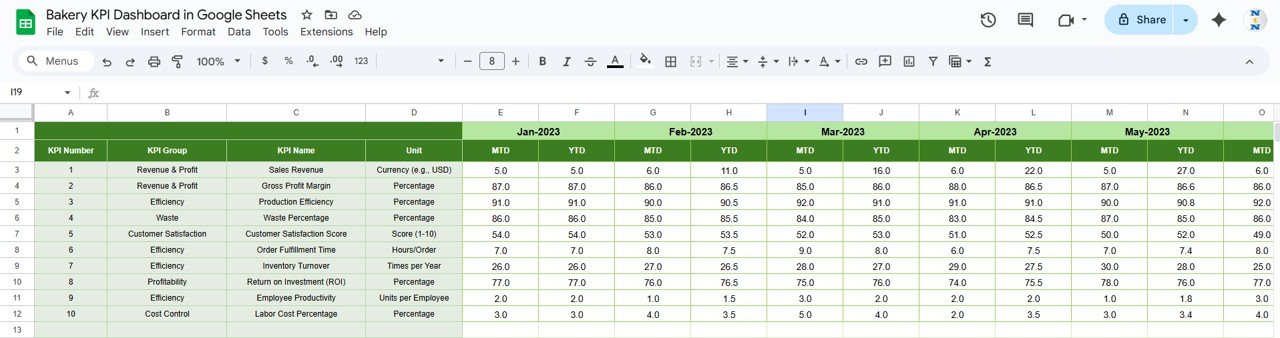
3. Actual Numbers Sheet Tab
-
Enter actual MTD and YTD values for each KPI
-
Update the first month of the year in Range E1 to adjust calculations automatically
This sheet ensures the dashboard reflects real performance data accurately.
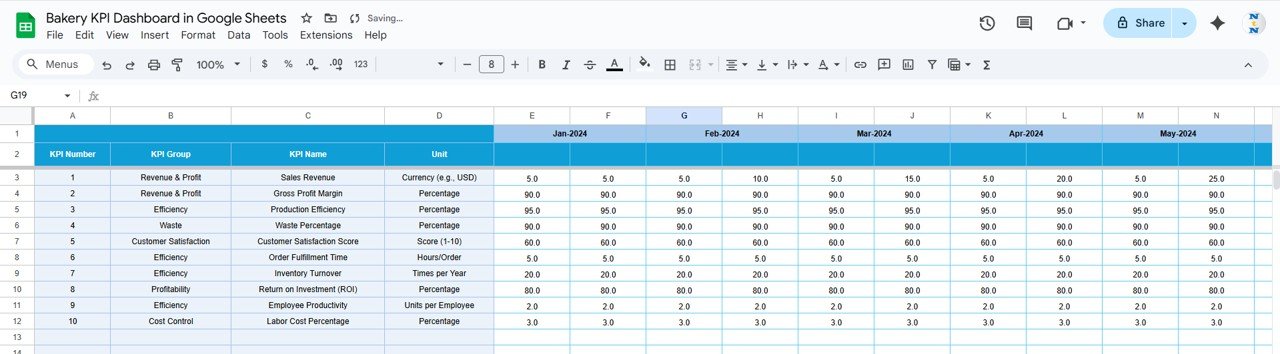
4. Target Sheet Tab
-
Enter monthly and yearly target values for all KPIs
-
Compare actual performance against planned targets
Setting clear targets helps track progress and ensures operational goals are met.
Click to Buy Bakery KPI Dashboard in Google Sheets
5. Previous Year Numbers Sheet Tab
-
Enter previous year’s KPI values
-
Enables year-over-year analysis to identify growth trends and improvements
This helps understand seasonal variations and long-term performance patterns.
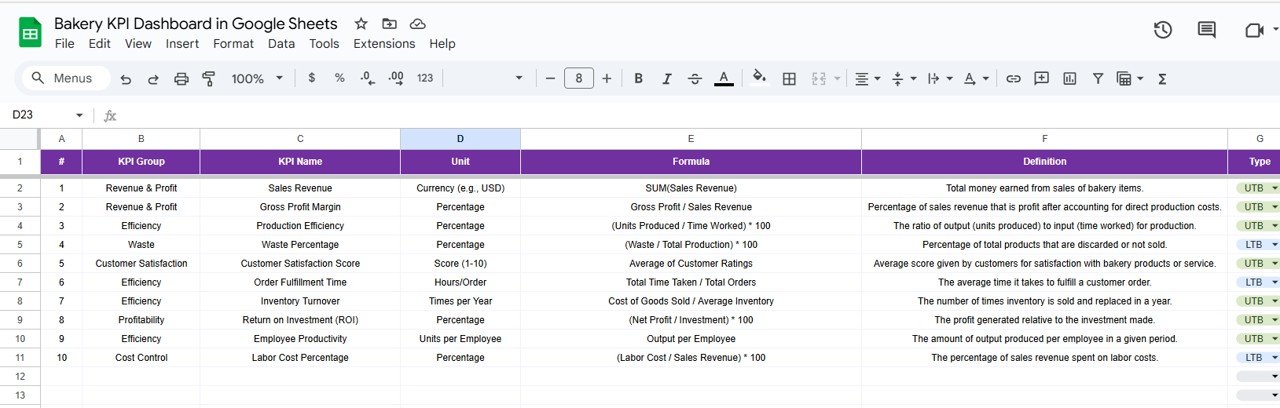
6. KPI Definition Sheet Tab
-
Document all KPI information: Name, Group, Unit, Formula, Definition, and Type (Upper-the-Better / Lower-the-Better)
-
Ensures consistency in measurement and clarity in reporting
This sheet acts as a reference for all KPIs in the dashboard.
Click to Buy Bakery KPI Dashboard in Google Sheets
Examples of KPIs to Track in a Bakery
Some important bakery KPIs include:
-
Total Sales ($): Revenue generated from bakery sales
-
Units Produced: Number of baked goods produced per day or month
-
Waste %: Percentage of production wasted (Lower-the-Better)
-
Customer Satisfaction Score: Feedback rating from customers
-
Orders Fulfilled On-Time (%): Percentage of orders delivered on schedule
-
Average Revenue per Customer ($): Revenue per transaction
-
Inventory Turnover: Efficiency of inventory usage
Each KPI should include:
-
Unit of Measure (e.g., $, %, count)
-
Formula (e.g., Revenue ÷ Number of Orders)
-
Performance Type (Upper-the-Better / Lower-the-Better)
Advantages of Using a Bakery KPI Dashboard
Click to Buy Bakery KPI Dashboard in Google Sheets
-
Centralized Data: All bakery performance metrics in one Google Sheet
-
Visual Insights: Cards and charts make trend analysis simple
-
Performance Monitoring: Track MTD and YTD performance efficiently
-
Identify Bottlenecks: Quickly spot areas where performance is lagging
-
Improve Decision-Making: Use data-driven insights for inventory, production, and sales strategies
-
Customizable: Add or remove KPIs based on your bakery’s operations
Best Practices for Using the Bakery KPI Dashboard
-
Update Data Regularly: Ensure actual sales, production, and inventory numbers are current
-
Segment KPIs by Product or Branch: Track performance for different products, departments, or locations
-
Monitor Trends: Use the KPI Trend Sheet to analyze historical performance
-
Set Realistic Targets: Use achievable benchmarks to evaluate performance
-
Focus on Actionable Insights: Address KPIs that impact sales, customer satisfaction, and production efficiency
-
Use Conditional Formatting: Highlight top-performing and underperforming KPIs
Frequently Asked Questions (FAQs)
Click to Buy Bakery KPI Dashboard in Google Sheets
Q1: Can I add new KPIs to the dashboard?
Yes, the dashboard is fully customizable. You can add or remove KPIs in the KPI Definition Sheet.
Q2: How often should I update the data?
Update monthly for MTD metrics or as often as daily if you want real-time tracking.
Q3: Can this dashboard track multiple bakery locations?
Yes, you can add location-specific KPIs or separate sheets for each bakery branch.
Q4: Is this dashboard suitable for small and large bakeries?
Absolutely. The Google Sheets format is flexible and scalable for any bakery size.
Q5: Can I visualize trends over time?
Yes, the KPI Trend Sheet allows you to track historical performance and analyze trends.
Conclusion
The Bakery KPI Dashboard in Google Sheets is an essential tool for bakery managers and owners to monitor performance, optimize production, track sales, and improve customer satisfaction. With MTD and YTD tracking, KPI trends, and detailed definitions, this dashboard helps bakeries make data-driven decisions to grow their business efficiently.
Visit our YouTube channel to learn step-by-step video tutorials
Youtube.com/@NeotechNavigators
Watch the step-by-step video Demo: