Managing team productivity and task performance is a vital aspect of modern workforce management. The Workforce Task Performance Dashboard in Google Sheets offers a dynamic and ready-to-use solution for organizations looking to monitor employee workload, task completion, and efficiency metrics — all in one place.Workforce Task Performance Dashboard in Google Sheets
In this article, we’ll explain the structure, key features, benefits, and best practices of using this dashboard to analyze and improve your team’s task performance.Workforce Task Performance Dashboard in Google Sheets
What Is a Workforce Task Performance Dashboard?
A Workforce Task Performance Dashboard is a digital management tool designed to visualize and analyze task-related KPIs (Key Performance Indicators). It helps managers track completed, pending, and overdue tasks while monitoring workload distribution and efficiency levels across departments and individuals.
By using Google Sheets, this dashboard provides an accessible, cloud-based platform that enables real-time collaboration, easy data updates, and clear insights into workforce productivity.
Key Features of the Workforce Task Performance Dashboard
Click to Buy Workforce Task Performance Dashboard in Google Sheets
This dashboard is designed with multiple interactive worksheets, each serving a specific purpose for performance tracking and trend analysis.
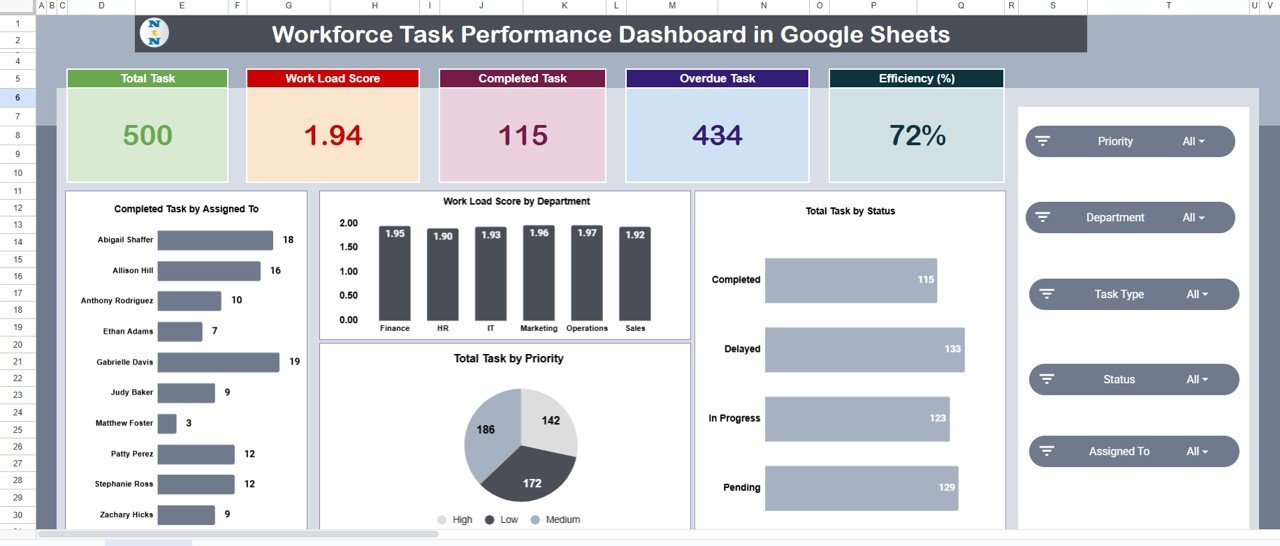
1. Overview Sheet Tab
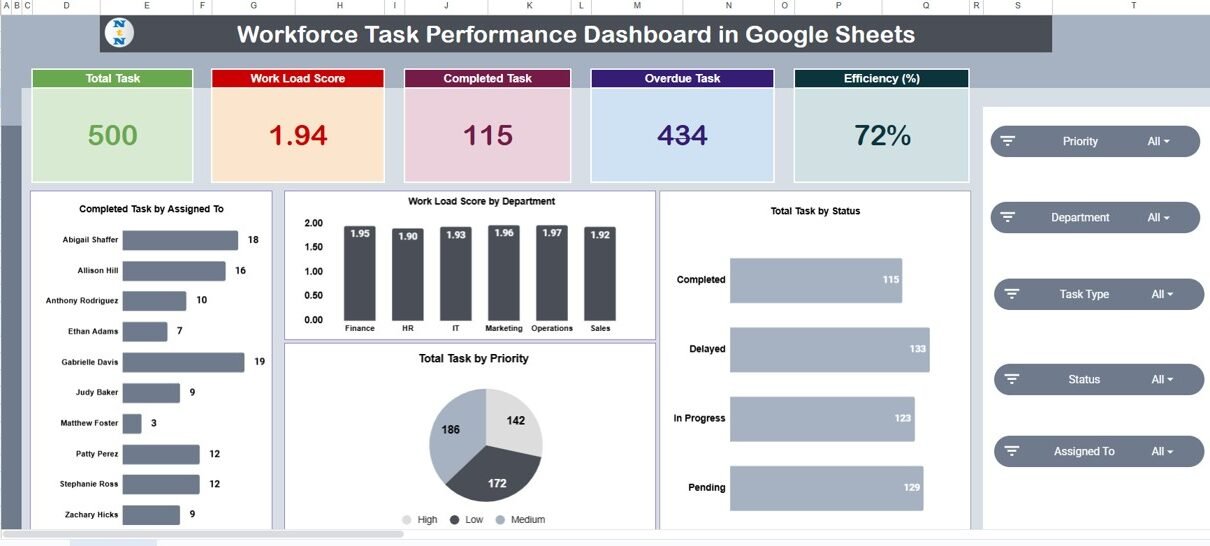
The Overview Sheet is the main control center of the dashboard. It displays key statistics and charts to help managers quickly understand workforce productivity at a glance.
Cards:
-
Total Tasks: Total number of tasks assigned across the organization
-
Work Load Score: Aggregated score representing task distribution and employee workload
-
Completed Tasks: Total number of successfully completed tasks
-
Overdue Tasks: Number of tasks pending beyond their due date
-
Efficiency (%): Ratio of completed tasks versus total assigned tasks
Charts:
-
Completed Tasks by Assigned To: Identifies the most productive employees
-
Work Load Score by Department: Displays workload intensity per department
-
Total Tasks by Status: Shows task distribution across statuses (Pending, In Progress, Completed)
-
Total Tasks by Priority: Highlights how workload is distributed by priority level (High, Medium, Low)
Click to Buy Workforce Task Performance Dashboard in Google Sheets
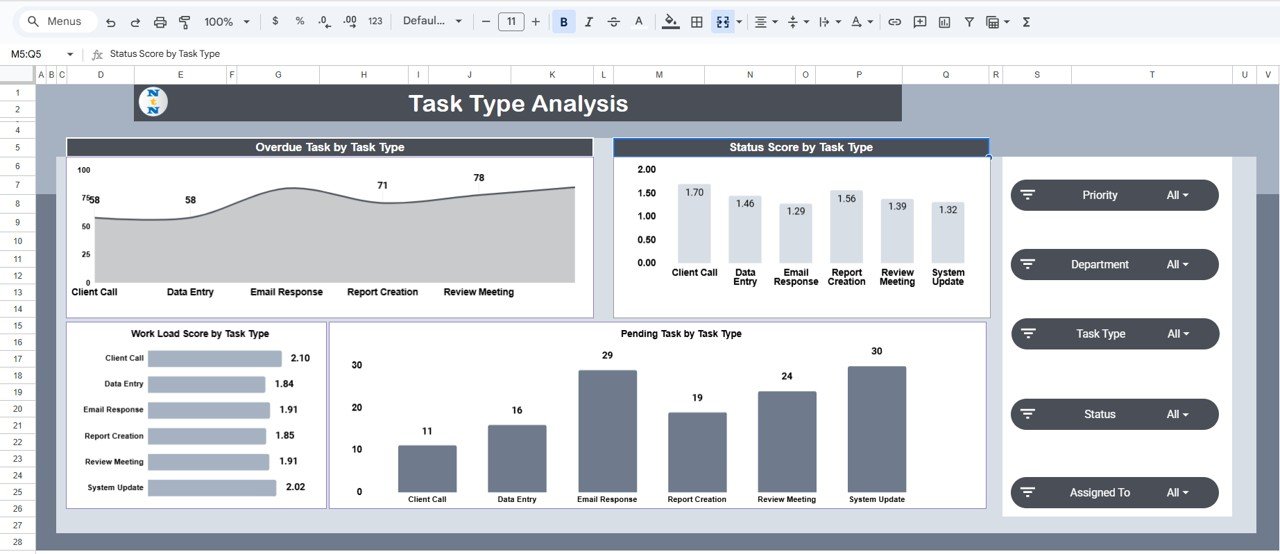
2. Task Type Analysis
This sheet focuses on performance across different task categories.
Charts:
-
Overdue Tasks by Task Type: Identifies task categories with the highest delays
-
Status Score by Task Type: Tracks the proportion of completed vs pending tasks per type
-
Work Load Score by Task Type: Displays task distribution by type
-
Pending Tasks by Task Type: Highlights uncompleted tasks for prioritization
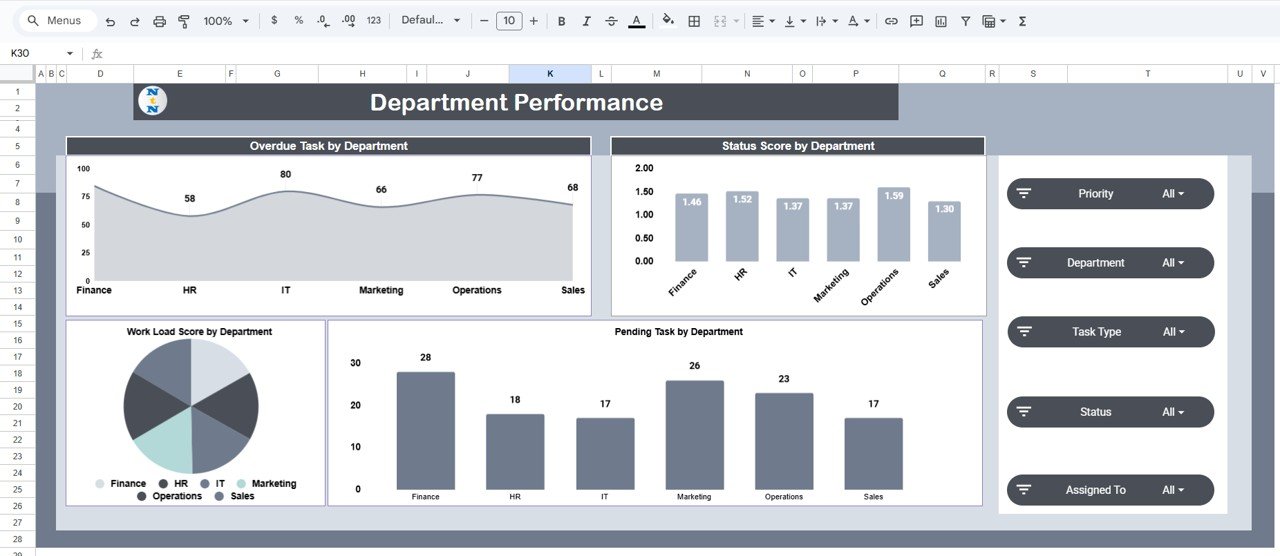
3. Department Performance
This section evaluates how departments perform relative to each other.
Charts:
-
Overdue Tasks by Department: Shows which departments need attention
-
Status Score by Department: Tracks completion efficiency per department
-
Work Load Score by Department: Compares workload across teams
-
Pending Tasks by Department: Helps identify departments with capacity challenges
Click to Buy Workforce Task Performance Dashboard in Google Sheets
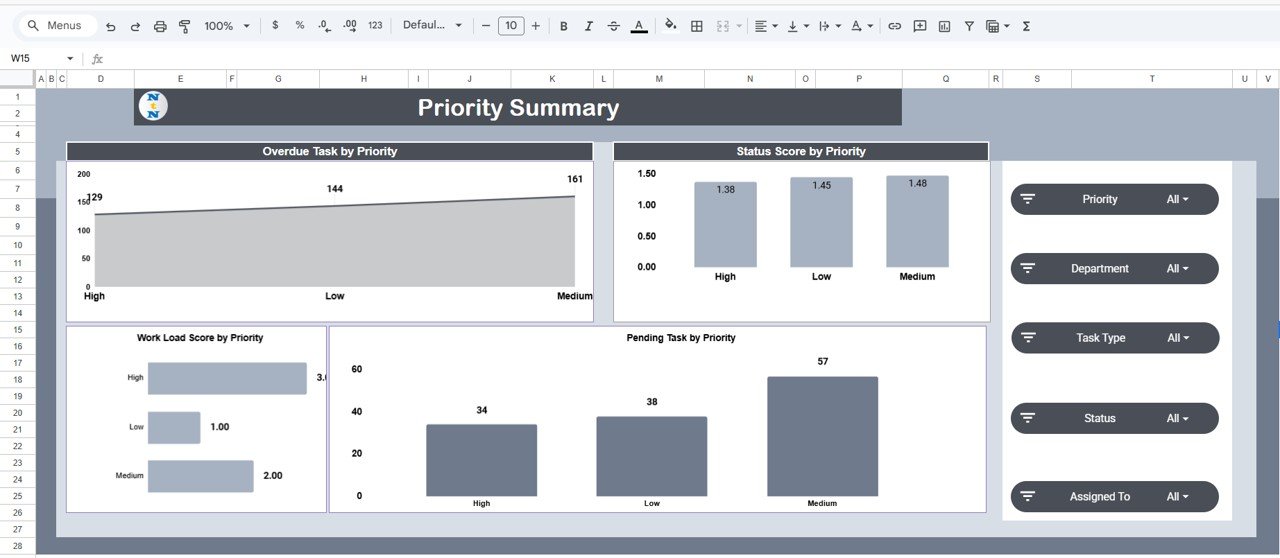
4. Priority Summary
This page analyzes how priority levels affect task performance.
Charts:
-
Overdue Tasks by Priority: Highlights high-priority tasks that are delayed
-
Status Score by Priority: Compares completion rates across priorities
-
Pending Tasks by Priority: Lists pending items by urgency
-
Work Load Score by Priority: Shows task allocation by priority category
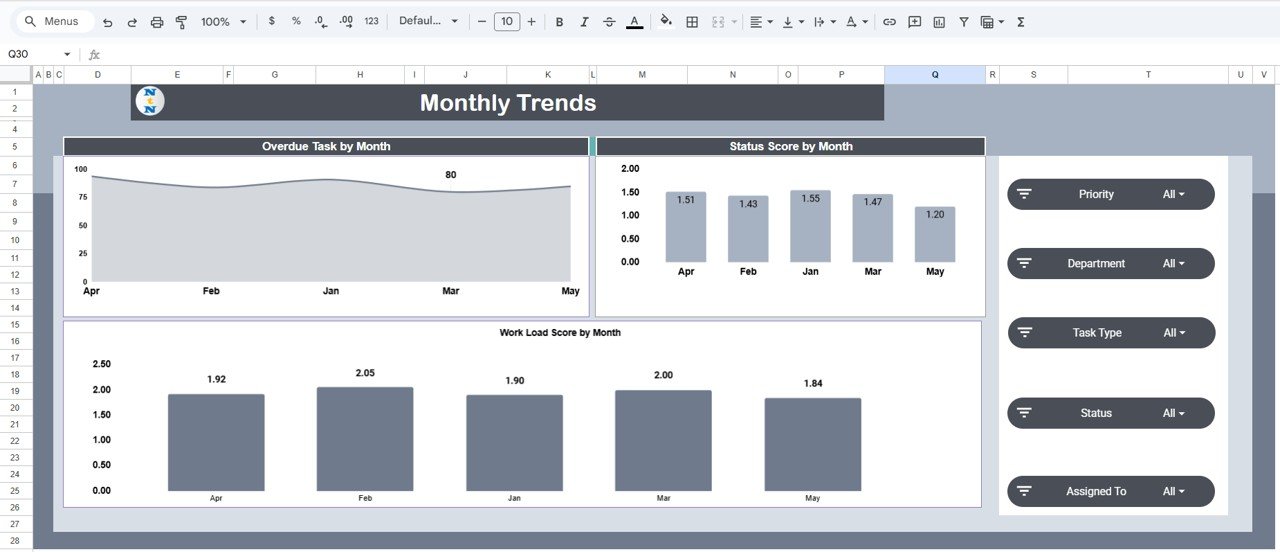
5. Monthly Trends
The Monthly Trends sheet captures performance evolution over time.
Charts:
-
Overdue Tasks by Month: Identifies patterns of missed deadlines
-
Status Score by Month: Measures monthly efficiency
-
Work Load Score by Month: Tracks workload variation throughout the year
Click to Buy Workforce Task Performance Dashboard in Google Sheets
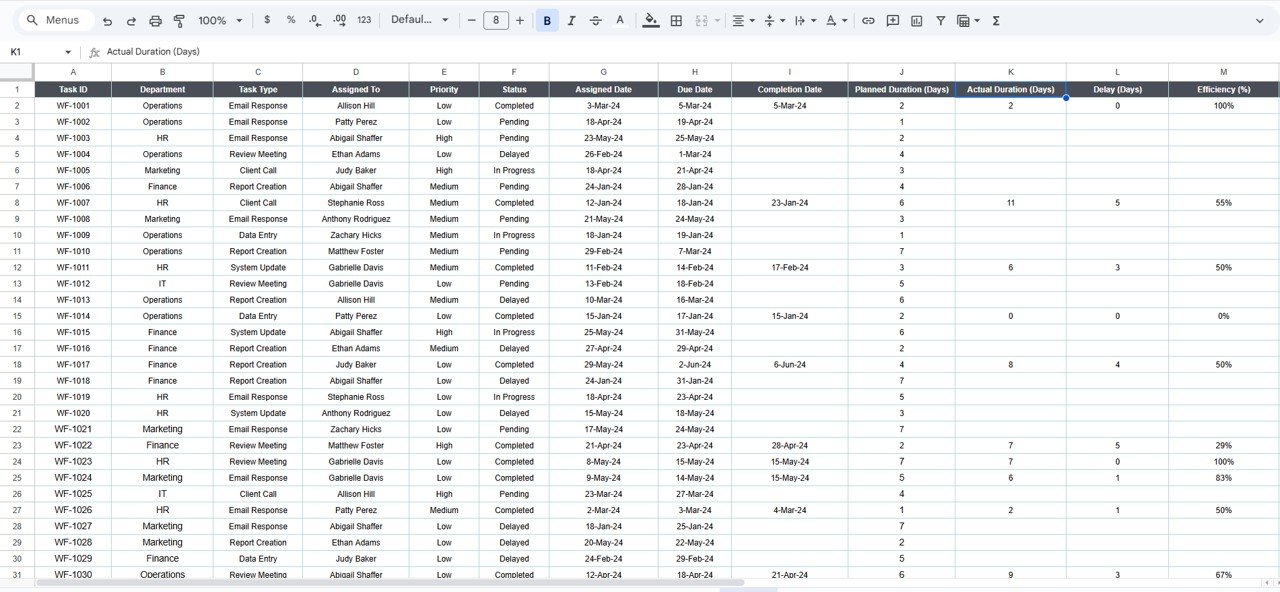
6. Data Sheet Tab
The Data Sheet serves as the input sheet for all task data.
It includes fields such as:
-
Task ID
-
Assigned To
-
Department
-
Task Type
-
Priority
-
Start Date / Due Date
-
Status
-
Completion Date
All visuals in the dashboard automatically update when new data is entered here.
Click to Buy Workforce Task Performance Dashboard in Google Sheets
Advantages of Using the Workforce Task Performance Dashboard
✅ Comprehensive Monitoring: Track productivity and workload across multiple dimensions — by person, department, task type, and priority.
✅ Real-Time Insights: Automatically update charts and KPIs as data changes.
✅ Improved Efficiency: Identify bottlenecks and overdue tasks quickly.
✅ Data-Driven Decisions: Base performance reviews and workload distribution on actual metrics.
✅ Enhanced Transparency: Teams can view progress and accountability clearly.
✅ Customizable & Scalable: Easily adapt to your organization’s needs or add new KPIs.
Best Practices for Using the Dashboard
-
Update Data Consistently: Enter task updates regularly to ensure dashboard accuracy.
-
Monitor Key KPIs: Focus on Efficiency %, Work Load Score, and Overdue Tasks for quick insights.
-
Identify Trends Early: Use monthly trends to forecast workload peaks and plan resources.
-
Balance Workload: Use “Work Load Score” charts to redistribute tasks fairly across teams.
-
Review Departmental Performance: Regularly analyze which departments require support or additional training.
How This Dashboard Helps Managers and Teams
Click to Buy Workforce Task Performance Dashboard in Google Sheets
The Workforce Task Performance Dashboard in Google Sheets bridges the gap between planning and performance tracking by offering:
-
Transparent Reporting: Visual metrics help management understand task distribution and completion.
-
Employee Accountability: Each team member’s workload and completion rate are visible.
-
Efficiency Tracking: Quickly pinpoint departments or projects causing delays.
-
Strategic Resource Planning: Identify overburdened teams and redistribute workload.
-
Performance Improvement: Track progress over time to evaluate training and process effectiveness.
Frequently Asked Questions (FAQs)
Click to Buy Workforce Task Performance Dashboard in Google Sheets
Q1: Can I customize the KPIs?
Yes, you can easily modify or add new KPIs in the KPI Trend and Data Sheet tabs.
Q2: How often should I update the data sheet?
It’s best to update it daily or weekly depending on your task volume.
Q3: Can I filter results by employee or department?
Yes, you can apply filters in the Overview and Department sheets to analyze specific segments.
Q4: Is the dashboard compatible with mobile devices?
Yes, Google Sheets is accessible across all devices for quick reviews on the go.
Q5: Can multiple users update the dashboard simultaneously?
Yes, multiple users can collaborate in real time using Google Sheets’ sharing feature.
Conclusion
The Workforce Task Performance Dashboard in Google Sheets is a powerful, ready-to-use tool that helps businesses track productivity, efficiency, and workload distribution. With its interactive charts and automated summaries, managers can make data-driven decisions, identify performance issues early, and optimize their team’s workflow for maximum efficiency.
Visit our YouTube channel to learn step-by-step video tutorials
Youtube.com/@NeotechNavigators
Watch the step-by-step video Demo:
Click to Buy Workforce Task Performance Dashboard in Google Sheets