Call centers play a vital role in customer satisfaction and brand reputation. Tracking the right metrics ensures that agents deliver quality service, response times are efficient, and performance goals are met. The Call Center KPI Scorecard in Google Sheets provides an all-in-one solution to monitor these performance indicators in real time.
In this detailed article, we’ll explore everything about this powerful template — its structure, KPI tracking mechanism, advantages, opportunities for improvement, best practices, and frequently asked questions.
What Is a Call Center KPI Scorecard in Google Sheets?
A Call Center KPI Scorecard in Google Sheets is a ready-to-use performance monitoring tool designed to measure and evaluate key metrics of a call center’s operations.
Built in Google Sheets, this scorecard helps supervisors and managers visualize performance data using interactive charts, trend analysis, and automatic traffic light indicators — all without requiring complex software or coding.
It’s designed to provide a monthly (MTD) and yearly (YTD) overview of call center performance, making it ideal for decision-making, reporting, and performance reviews.
Scorecard Sheet Tab Overview
Click to Buy Call Center KPI Scorecard in Google Sheets
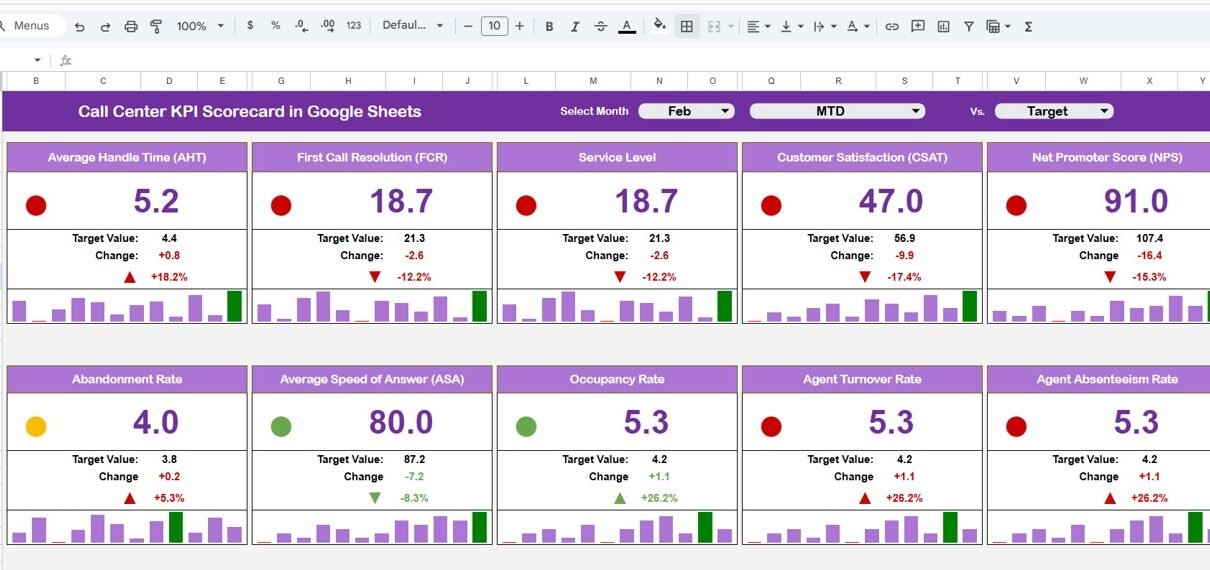
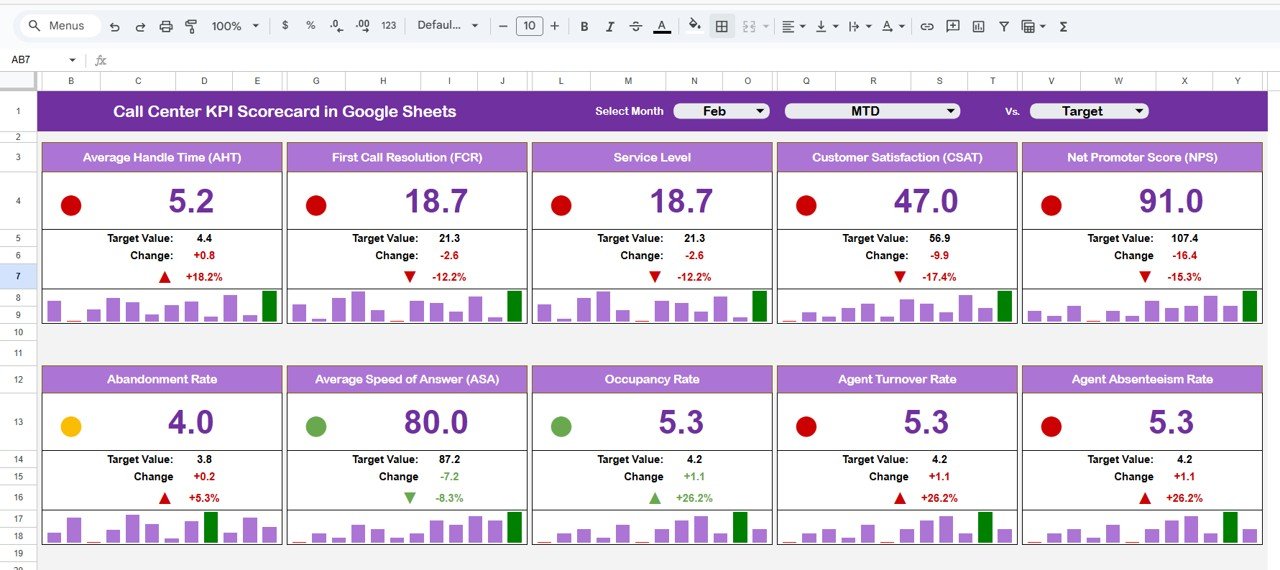
The Scorecard Sheet Tab serves as the central dashboard of the template. It combines data visualization, color-coded indicators, and dynamic formulas to provide a snapshot of overall call center performance.
Key Features in the Scorecard Sheet
Month Dropdown (Top Section):
Easily select any month from the dropdown to view performance metrics for that specific period. Once the month is changed, all values, charts, and indicators update automatically.
MTD and YTD Toggle Buttons:
- MTD (Month-To-Date): View the performance of the selected month.
- YTD (Year-To-Date): Switch to a yearly summary of performance.
This allows users to analyze short-term vs. long-term trends at a click.
Traffic Light Indicators:
Automatically color-coded KPIs highlight performance status —
- 🟢 Green: Target met or exceeded
- 🟡 Yellow: Slightly below target
- 🔴 Red: Underperformance
Up/Down Arrows:
Each KPI also includes arrows to show improvement or decline from the previous period, along with percentage change values.
Example KPIs in the Scorecard
Click to Buy Call Center KPI Scorecard in Google Sheets
The scorecard tracks 10 essential KPIs, including:
- Average Handling Time (AHT)
- First Call Resolution (FCR)
- Customer Satisfaction (CSAT)
- Call Abandonment Rate
- Agent Utilization Rate
- Average Wait Time
- Call Answer Rate
- Net Promoter Score (NPS)
- Call Transfer Rate
- Total Calls Handled
Each KPI includes Actual, Target, and Variance (%) columns to instantly evaluate whether performance goals are achieved.
Click to Buy Call Center KPI Scorecard in Google Sheets
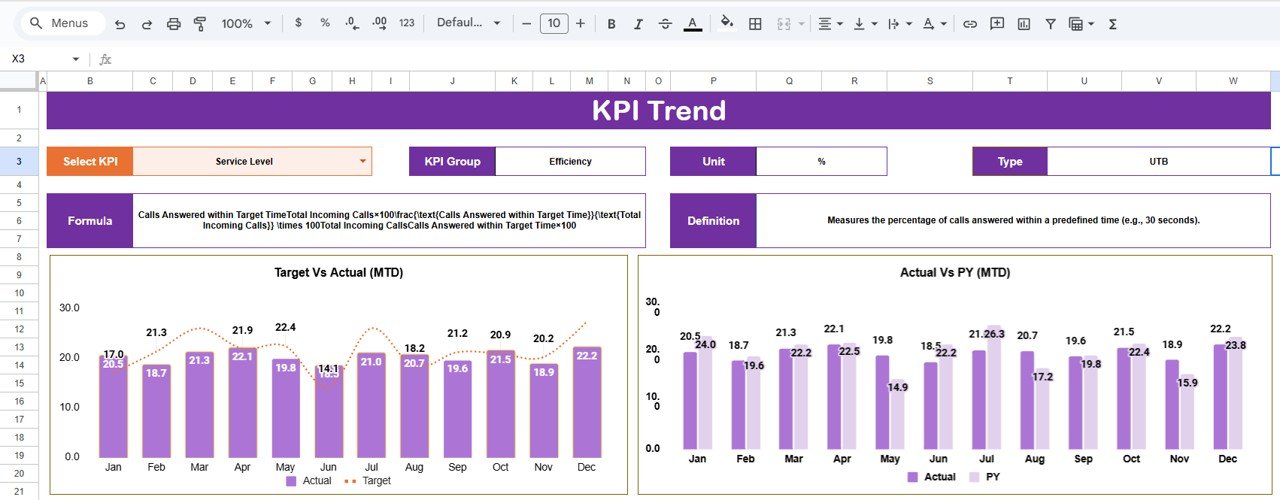
Trend Sheet Tab
The Trend Sheet Tab allows users to analyze the historical performance of individual KPIs across months or quarters.
-
The dropdown in cell C3 lets you select any KPI from the list.
-
Once selected, the chart automatically updates to show its trend over time.
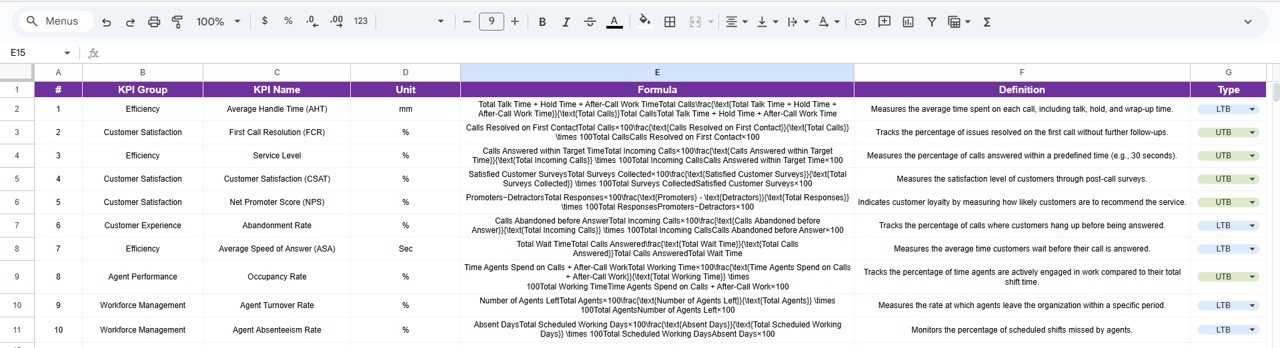
KPI Definition Sheet Tab
The KPI Definition Sheet Tab serves as a reference table containing all necessary KPI information, helping maintain consistency in measurement and understanding.
Columns in This Tab:
-
KPI Group: Category such as Efficiency, Quality, or Customer Experience.
-
KPI Name: The specific metric being tracked (e.g., CSAT, AHT).
-
Unit: The measurement unit (% or Minutes).
-
Formula: The calculation logic for each KPI.
-
Definition: A short explanation of what the KPI measures and why it matters.
-
Type: Identifies whether a higher or lower value indicates better performance.
Click to Buy Call Center KPI Scorecard in Google Sheets
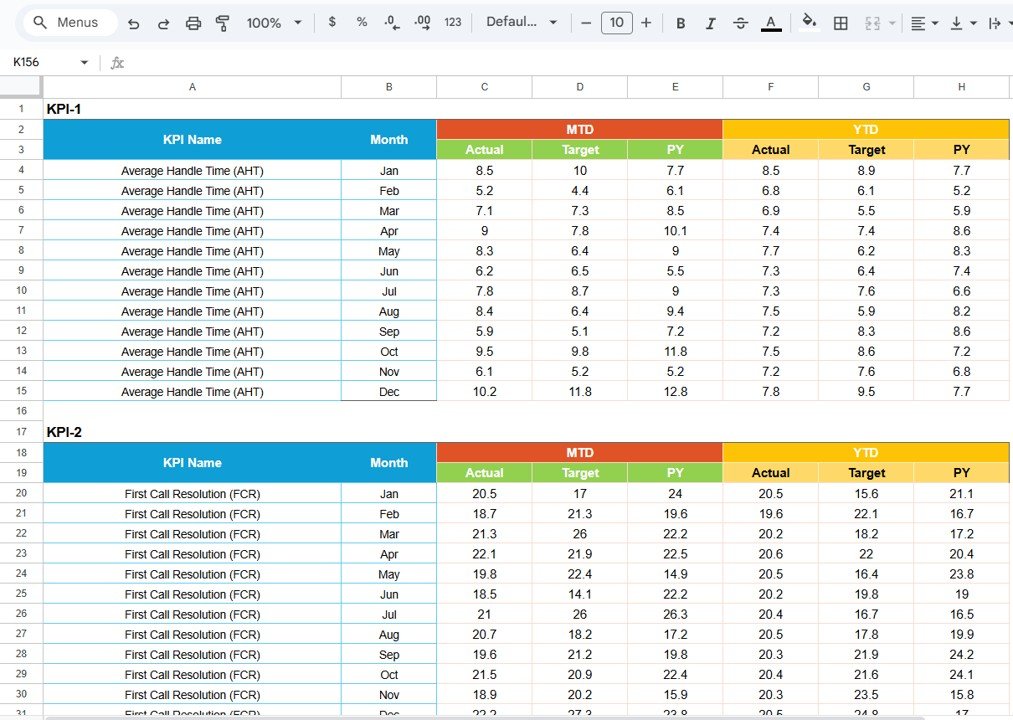
Data Input Sheet Tab
The Data Input Sheet Tab is the backbone of the entire system.
This is where users enter monthly performance data for each KPI.
Typical columns include:
- Month
- KPI Name
- Actual Value
- Target Value
- Previous Month Value
- Year-To-Date Value
Data Input Sheet Tab
Click to Buy Call Center KPI Scorecard in Google Sheets
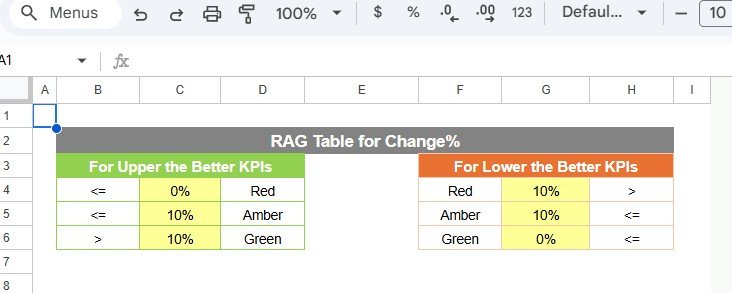
🎨 Color Settings
Color-coded visuals make this scorecard intuitive and easy to interpret.
Advantages of the Call Center KPI Scorecard
-
Real-Time Performance Tracking: Instantly visualize KPI achievements.
-
Interactive Dashboard: Switch between months or YTD summaries with one click.
-
Visual Feedback: Traffic lights and arrows make performance easy to interpret.
-
Team Alignment: Keeps everyone focused on key operational metrics.
-
Improved Decision-Making: Identify underperforming areas quickly.
-
Google Sheets-Based: Easy to access, share, and update collaboratively.
-
Error-Free Automation: Dynamic formulas eliminate manual recalculations.
Opportunities for Improvement
Click to Buy Call Center KPI Scorecard in Google Sheets
While the scorecard is robust, there’s always room for enhancement:
-
Automation with Google Apps Script: Send automatic alerts when KPIs fall below targets.
-
Drill-Down Analysis: Add slicers or filters for agent-level analysis.
-
Integration with CRM/Call Software: Auto-fetch KPI data directly from systems like Zendesk or Salesforce.
-
Weekly Snapshot Dashboard: Include week-over-week trend comparisons.
-
Comment Section: Allow managers to record action plans beside each KPI.
Best Practices for Using the Call Center KPI Scorecard
Click to Buy Call Center KPI Scorecard in Google Sheets
-
Update Data Monthly: Ensure all metrics are entered promptly for accuracy.
-
Use Consistent Units: Maintain uniform measurement units across all KPIs.
-
Review Trends Regularly: Use the Trend Sheet to identify recurring issues.
-
Set Realistic Targets: Ensure goals motivate improvement but remain achievable.
-
Automate Where Possible: Use built-in formulas or scripts for routine updates.
-
Protect Data Integrity: Restrict edit access to authorized personnel only.
-
Encourage Team Review: Share the dashboard in meetings to promote accountability.
Conclusion
The Call Center KPI Scorecard in Google Sheets is a powerful, interactive, and easy-to-use solution for tracking your contact center’s performance. With real-time insights, traffic light visuals, and dynamic charts, it empowers managers to make data-driven decisions that improve efficiency and customer satisfaction.
Whether you’re managing a small support desk or a large call center operation, this scorecard offers the perfect balance of simplicity, automation, and clarity — all within Google Sheets.
Frequently Asked Questions (FAQ)
Click to Buy Call Center KPI Scorecard in Google Sheets
1. Can I customize the KPIs in the scorecard?
Yes, you can modify or add new KPIs in the KPI Definition Sheet.
2. Does the scorecard work for both inbound and outbound call centers?
Yes, it’s flexible enough to track KPIs for any type of call center.
3. Can I automate data import from other tools?
Yes, using Google Apps Script or integrations like Zapier, you can automate data imports.
4. How do the traffic lights and arrows update?
They use conditional formatting and formula logic that auto-adjusts with new data.
5. Can multiple team members use the dashboard simultaneously?
Yes, Google Sheets supports real-time collaboration and access control.
Visit our YouTube channel to learn step-by-step video tutorials