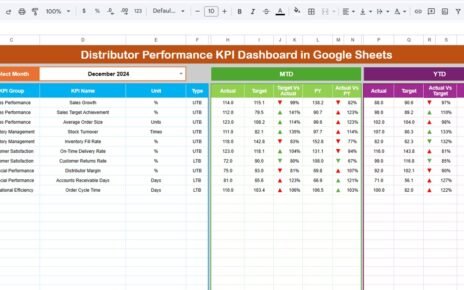
Customer Relationship Management (CRM) is at the heart of every successful business. Tracking CRM performance ensures that teams manage leads, conversions, and customer satisfaction efficiently. The CRM KPI Scorecard in Google Sheets provides a powerful, visual, and automated way to measure these key metrics.
This ready-to-use scorecard allows you to monitor, analyze, and improve your CRM performance with dynamic dashboards, trend charts, and color-coded indicators — all built within Google Sheets.
In this article, we’ll explore the structure, KPIs, features, advantages, improvement opportunities, best practices, and FAQs for this template.
What Is a CRM KPI Scorecard in Google Sheets?
Click to Buy CRM KPI Scorecard in Google Sheets
A CRM KPI Scorecard is an interactive tool that tracks the performance of your sales and customer management activities.
Built entirely in Google Sheets, this scorecard helps you:
-
Visualize monthly and yearly CRM performance.
-
Compare Actual vs Target values.
-
Analyze trends across customer engagement, sales pipeline, and retention.
-
Automatically change visual indicators (traffic lights and arrows) based on performance.
This scorecard enables data-driven decision-making without complex CRM software.
Structure of the CRM KPI Scorecard
The scorecard consists of multiple sheets, each serving a dedicated analytical function:
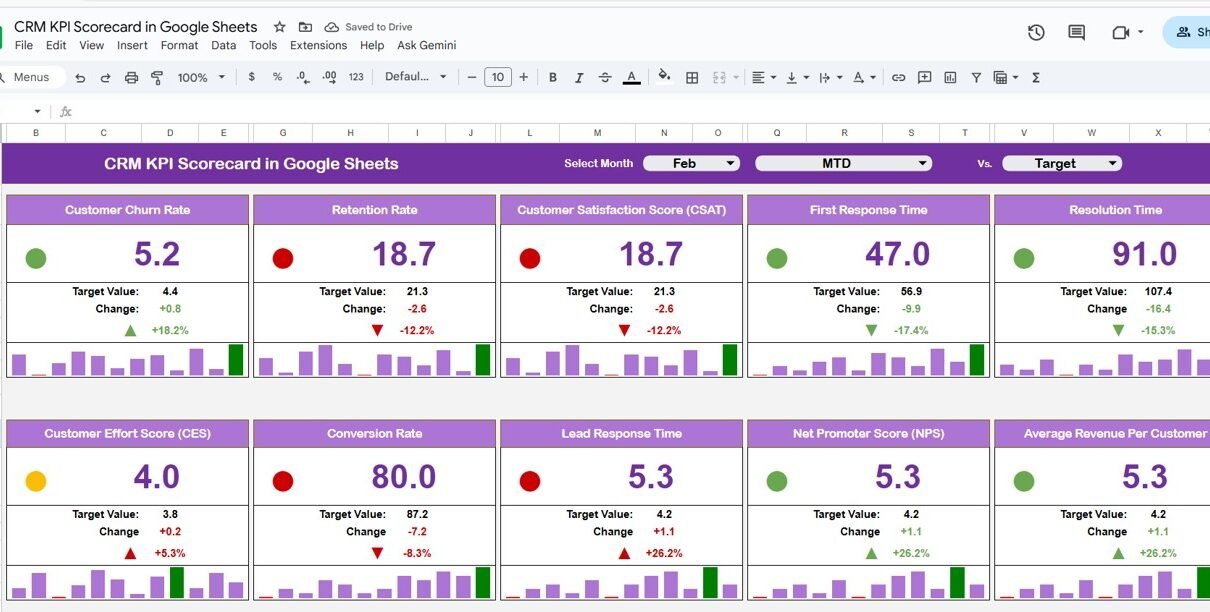
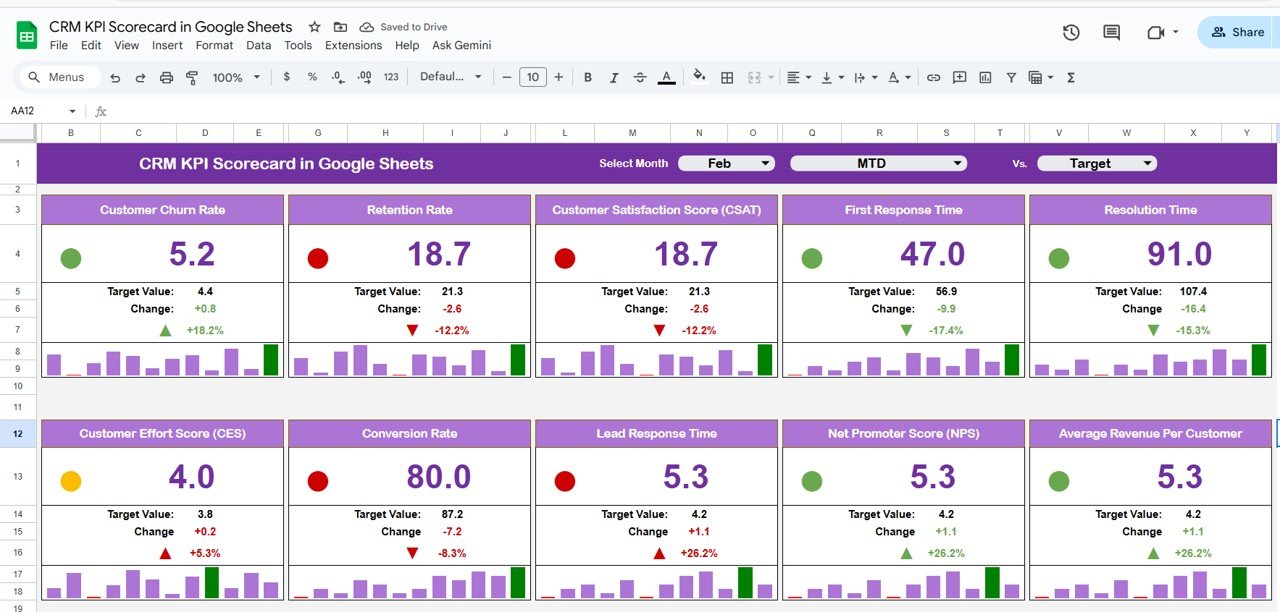
Scorecard Sheet Tab (Main Dashboard)
This is the central view of your CRM KPIs.
-
Month Selector (Dropdown on Range D3): Choose any month, and all KPI values update automatically.
-
MTD / YTD Toggle Buttons:
- Click MTD (Month-To-Date) to view current month data.
- Click YTD (Year-To-Date) to view cumulative yearly performance.
Conditional Formatting:
- 🟢 Green Light: Target achieved or exceeded.
- 🟡 Yellow Light: Near target.
- 🔴 Red Light: Below target.
- ⬆️ Up Arrow: Performance improved compared to last month.
- ⬇️ Down Arrow: Performance declined.
This sheet gives managers a quick visual snapshot of CRM health.
Click to Buy CRM KPI Scorecard in Google Sheets
2️⃣ Trend Sheet Tab
The Trend Sheet provides a deeper look into individual KPI performance over time.
-
Dropdown (Cell C3): Select a KPI to view detailed trend charts.
Displays:
- KPI Group
- Unit
- Type (UTB/LTB)
- Formula
- Definition
This tab helps identify growth patterns, declines, and seasonality in CRM activities.

Click to Buy CRM KPI Scorecard in Google Sheets
KPI Definition Sheet Tab
This sheet contains the detailed KPI framework — with all KPIs, formulas, and definitions clearly outlined.
Here’s an example of the KPI Definition Table used in this scorecard:

This sheet stores all raw CRM data, including Actual, Target, and Previous Year values.
-
Each month’s data is entered for every KPI.
-
Automatically updates MTD and YTD views in the dashboard.
-
Includes validation checks for consistent formatting.
Columns typically include:
- Month
- KPI Group
- KPI Name
- Unit
- MTD Actual
- MTD Target
- YTD Actual
- YTD Target
- Previous Year

Click to Buy CRM KPI Scorecard in Google Sheets
5️⃣ Color Settings Tab
This sheet controls all visual indicators for performance levels.

Advantages of the CRM KPI Scorecard
-
Holistic CRM View: Combines lead, sales, engagement, and satisfaction metrics.
-
Real-Time Performance: Automatically updates KPI visuals and comparisons.
-
Decision Support: Quickly identifies weak and strong areas.
-
Customizable KPIs: Add or modify metrics as per business needs.
-
Accessible Anywhere: Cloud-based and shareable through Google Sheets.
-
Visual Impact: Traffic lights and arrows make data interpretation instant.
-
Historical Comparison: Year-over-year and month-over-month comparisons.
Opportunities for Improvement
Click to Buy CRM KPI Scorecard in Google Sheets
You can enhance this dashboard further with automation and integrations:
-
Connect with CRM Tools: Integrate with HubSpot, Zoho, or Salesforce via API or Apps Script.
-
Automate Data Entry: Import CRM data automatically to reduce manual updates.
-
Email Alerts: Trigger notifications for KPIs below target.
-
Add Forecasting: Predict future performance using historical data trends.
-
Combine with Revenue Tracker: Merge with financial KPIs for end-to-end performance visibility.
Best Practices for Using the Scorecard
-
Update Data Monthly: Keep Actual and Target values current.
-
Set Realistic Targets: Align goals with achievable business benchmarks.
-
Train Users: Educate sales teams on how to interpret KPI trends.
-
Validate Data: Regularly verify CRM data accuracy.
-
Use Comments/Notes: Add remarks for context on underperforming KPIs.
-
Review Regularly: Conduct monthly and quarterly KPI review meetings.
Conclusion
Click to Buy CRM KPI Scorecard in Google Sheets
The CRM KPI Scorecard in Google Sheets is a must-have for organizations that want a clear, data-driven view of customer management performance. It combines visual analytics, automation, and simplicity — all within a familiar Google Sheets environment.
By tracking key CRM metrics like conversion, retention, and satisfaction, this tool empowers teams to make faster, smarter decisions and build stronger customer relationships.
Frequently Asked Questions (FAQ)
1. Can I add more than 10 KPIs?
Yes, you can expand the KPI Definition Sheet to include additional CRM metrics.
2. Can this scorecard integrate with my CRM system?
Yes, using Google Apps Script or connectors like Zapier, you can automate data syncing.
3. How does it calculate MTD vs YTD?
MTD and YTD are calculated automatically using SUM and logic formulas based on the selected month.
4. Can I track both sales and customer support KPIs?
Yes, the scorecard covers all CRM areas — from lead management to support and satisfaction.
5. Can I export the dashboard to PDF for reporting?
Yes, you can easily export monthly reports from Google Sheets as PDFs.
Visit our YouTube channel to learn step-by-step video tutorials
Youtube.com/@NeotechNavigators
Watch the step-by-step video Demo: