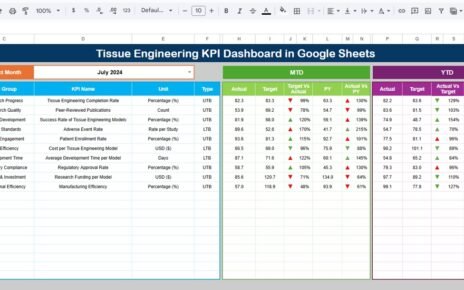
The real estate industry thrives on performance measurement — from property sales and rental income to occupancy rates and marketing effectiveness. The Real Estate KPI Scorecard in Google Sheets is a ready-to-use, dynamic, and fully customizable template that helps real estate agencies, brokers, and property managers analyze business performance through key performance indicators (KPIs).Real Estate KPI Scorecard in Google Sheets
This guide explains the structure, key features, KPI definitions, advantages, opportunities for improvement, and best practices for using this scorecard effectively.Real Estate KPI Scorecard in Google Sheets
What Is a Real Estate KPI Scorecard in Google Sheets?
A Real Estate KPI Scorecard is a data-driven tool that tracks the most critical performance indicators across real estate operations — helping teams monitor growth, profitability, and operational efficiency.
Using Google Sheets, this scorecard brings together automation, visualization, and collaboration to provide instant performance insights.
It allows you to:
-
View Monthly (MTD) and Yearly (YTD) KPIs.
-
Compare Actual vs Target vs Previous Year data.
-
Identify performance gaps using up/down arrows and color-coded traffic lights.
-
Track detailed KPI trends for deeper performance analysis.
Structure of the Real Estate KPI Scorecard
This Google Sheets-based scorecard consists of five primary worksheets, each designed to organize and visualize performance metrics effectively.
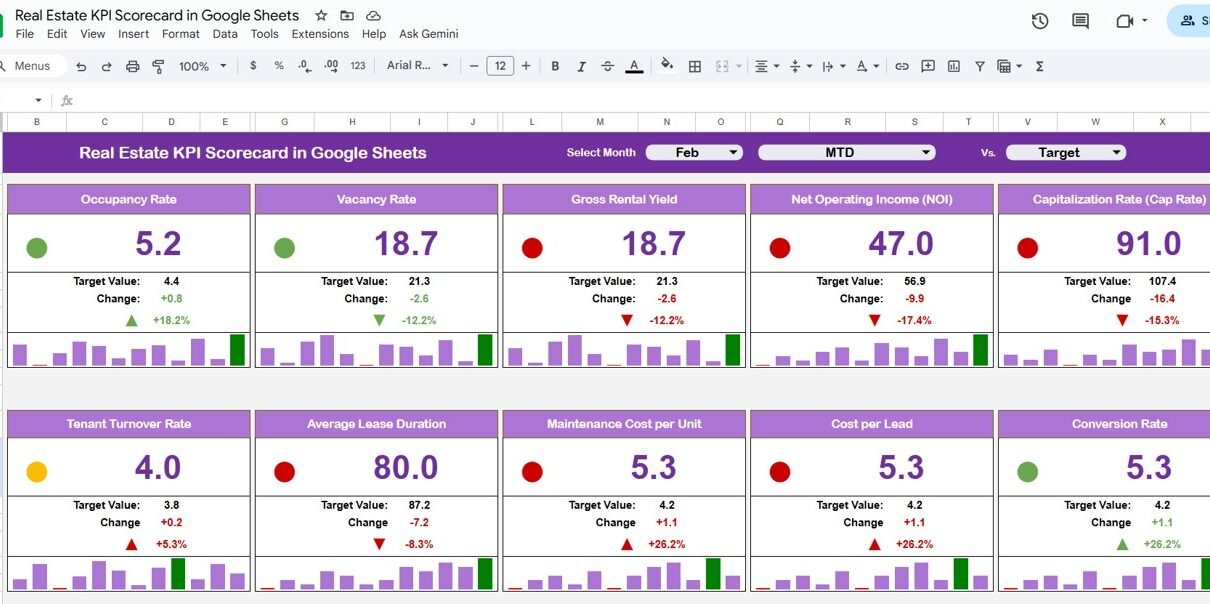
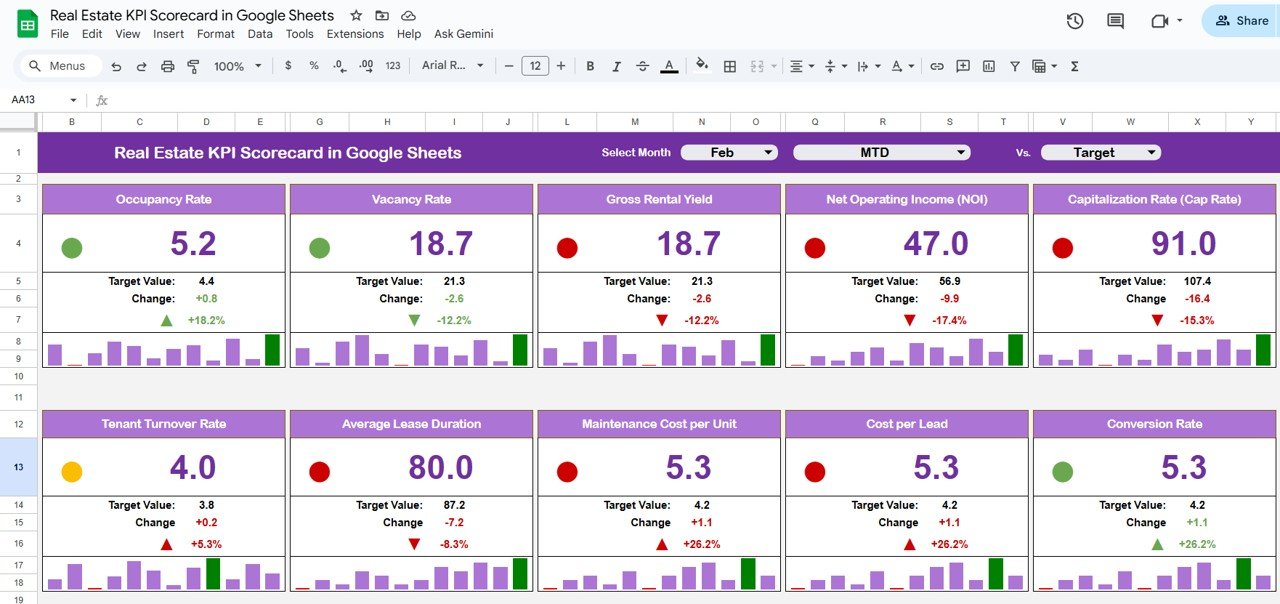
Dashboard Sheet Tab
The Dashboard is the main interface of the scorecard. It displays all KPI results, allowing you to select a month from a dropdown menu (cell D3).
Key Features:
-
Shows MTD (Month-to-Date) and YTD (Year-to-Date) data.
-
Automatically compares performance with Targets and Previous Year.
-
Displays visual indicators — arrows and traffic lights — for quick interpretation.
-
This makes it easy for property managers to instantly identify areas performing above or below expectations.
Click to Buy Real Estate KPI Scorecard in Google Sheets
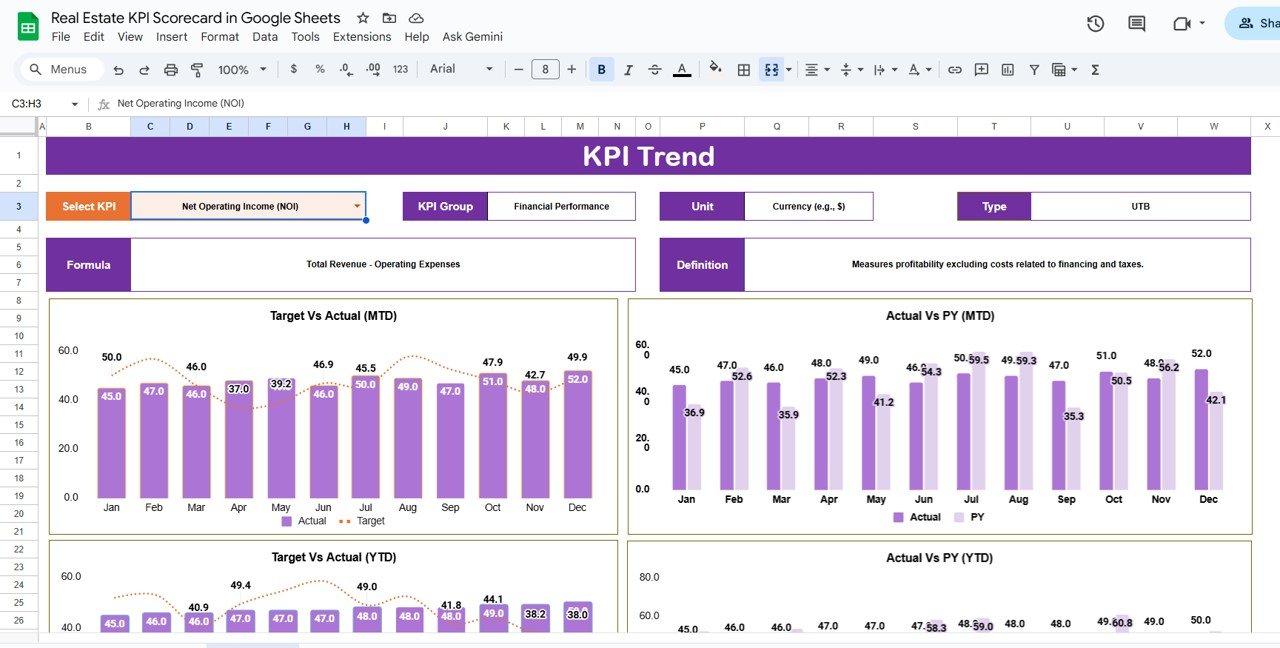
KPI Trend Sheet Tab
The Trend Sheet Tab helps analyze each KPI over time.
How It Works:
Select a KPI name from the dropdown (cell C3).
The sheet automatically displays:
- KPI Group
- Unit of Measurement
- KPI Type (UTB or LTB)
- Formula
- KPI Definition
This allows you to track performance across months and understand long-term trends.
Click to Buy Real Estate KPI Scorecard in Google Sheets
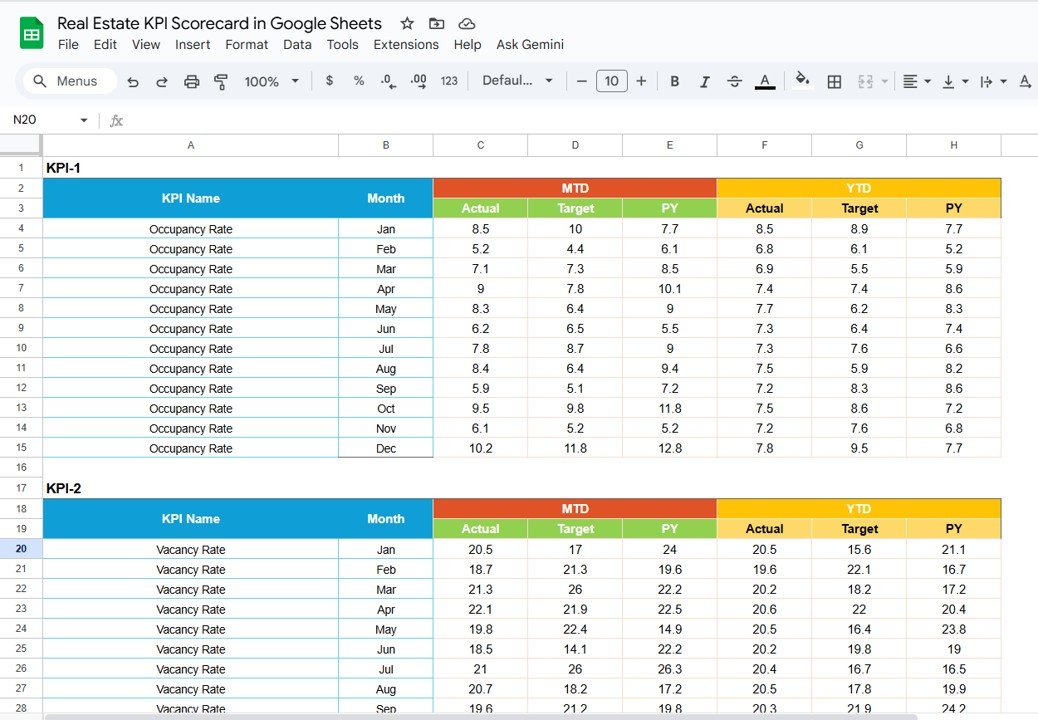
Input Data Sheet Tab
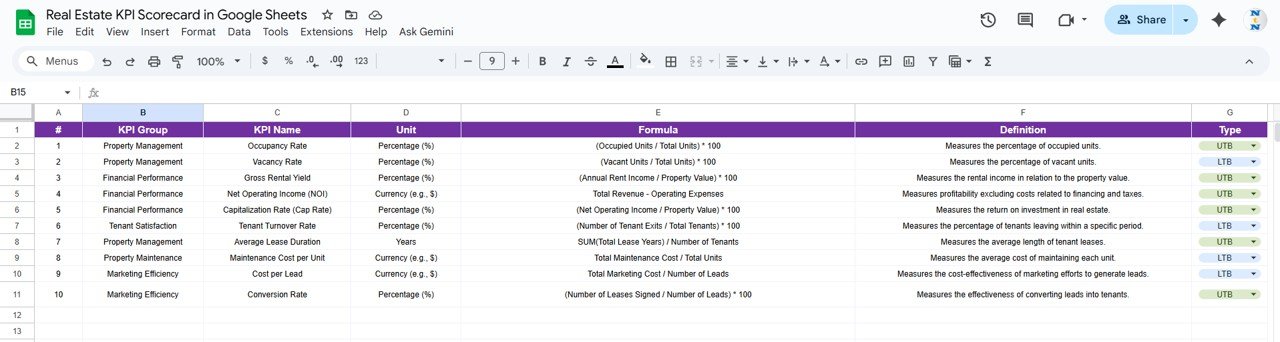
KPI Definition:
Click to Buy Real Estate KPI Scorecard in Google Sheets
Advantages of the Real Estate KPI Scorecard
-
Instant Performance Insights: Quickly visualize performance through color-coded indicators.
-
Automated Comparison: Automatically calculates variances vs target and previous year.
-
Cloud Collaboration: Share with teams in real time for joint performance tracking.
-
Customization: Add or modify KPIs as per your business model.
-
Trend Analysis: Track progress of individual KPIs over time.
-
No Additional Software: Built entirely in Google Sheets — no installation required.
Opportunities for Improvement
You can enhance the scorecard’s functionality further with these ideas:
-
Integration with Google Forms: Automate monthly data collection from different departments.
-
Automated Email Reports: Send performance summaries to stakeholders automatically.
-
Dashboard Filters: Add filters by property type, location, or agent.
-
Forecasting Models: Use Google Sheets formulas to project future sales or occupancy trends.
-
Visual Enhancements: Add dynamic charts or gauges for each KPI.
Best Practices for Using the Scorecard
Click to Buy Real Estate KPI Scorecard in Google Sheets
-
Keep Data Updated: Enter KPI data monthly for accurate insights.
-
Ensure Target Accuracy: Set realistic yet challenging goals.
-
Monitor Trends: Review the KPI Trend Tab regularly for early warning signals.
-
Maintain Data Quality: Validate inputs to prevent reporting errors.
-
Protect Critical Sheets: Lock formula cells and protect layout from accidental edits.
-
Review Performance: Conduct monthly review meetings based on KPI trends.
Conclusion
The Real Estate KPI Scorecard in Google Sheets provides real estate professionals with a clear, visual, and automated performance monitoring system.
From sales and leasing to maintenance and customer satisfaction, every KPI is measured in real-time, empowering management teams to make data-driven decisions, improve profitability, and enhance overall operational control.
This dashboard is an essential tool for any real estate organization aiming to align performance with strategic goals — all within an easy-to-use Google Sheets framework.
Frequently Asked Questions (FAQ)
Click to Buy Real Estate KPI Scorecard in Google Sheets
1. Can I add more KPIs?
Yes, you can expand the KPI Definition tab to include new metrics as needed.
2. Can I track multiple properties or locations?
Yes, by adding “Property” or “Location” fields in the data sheet, you can filter results accordingly.
3. Can I share this dashboard with team members?
Yes, Google Sheets allows real-time collaboration and editing.
4. How can I change the color settings?
Adjust conditional formatting rules to customize colors for performance indicators.
5. Can I export reports?
Yes, export the dashboard to PDF or Excel for sharing or printing monthly reports.
Visit our YouTube channel to learn step-by-step video tutorials
Youtube.com/@NeotechNavigators
Watch the step-by-step video Demo: