In the modern era of sustainable development, tracking and optimizing environmental performance is no longer optional — it’s essential. Whether you manage corporate buildings, educational institutions, or commercial spaces, sustainability performance directly impacts cost savings, environmental footprint, and brand reputation.
That’s where the Green Building KPI Dashboard in Google Sheets comes in — a powerful, ready-to-use analytics tool that helps you measure and monitor sustainability performance using Key Performance Indicators (KPIs).
Built in Google Sheets, this dashboard simplifies complex data and converts it into actionable insights — allowing facility managers, sustainability teams, and decision-makers to track performance in real time.
Click to buy Green Building KPI Dashboard in Google Sheets
What Is a Green Building KPI Dashboard in Google Sheets?
A Green Building KPI Dashboard in Google Sheets is an interactive spreadsheet designed to evaluate a building’s environmental performance across various sustainability metrics.
It enables users to measure and visualize KPIs such as:
- Energy consumption efficiency
- Water usage performance
- Waste recycling rates
- Indoor air quality
- Carbon footprint
- Renewable energy utilization
With built-in formulas, charts, and dynamic dropdowns, this dashboard automates reporting and ensures that you can easily monitor Month-to-Date (MTD) and Year-to-Date (YTD) performance — all in one place.
Structure of the Green Building KPI Dashboard
This dashboard includes six key worksheet tabs, each serving a specific function for data input, tracking, and analysis.
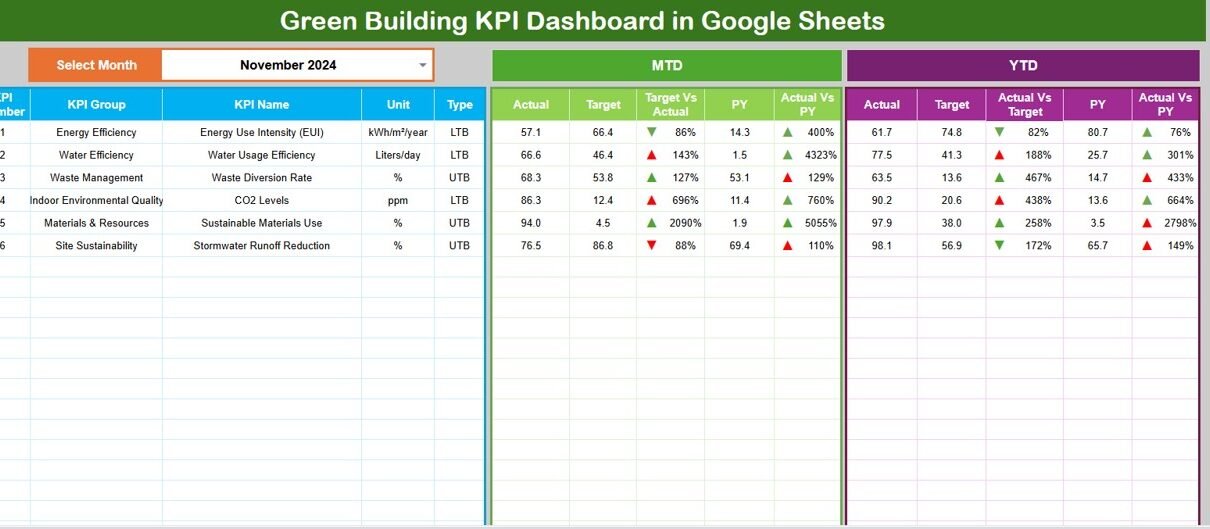
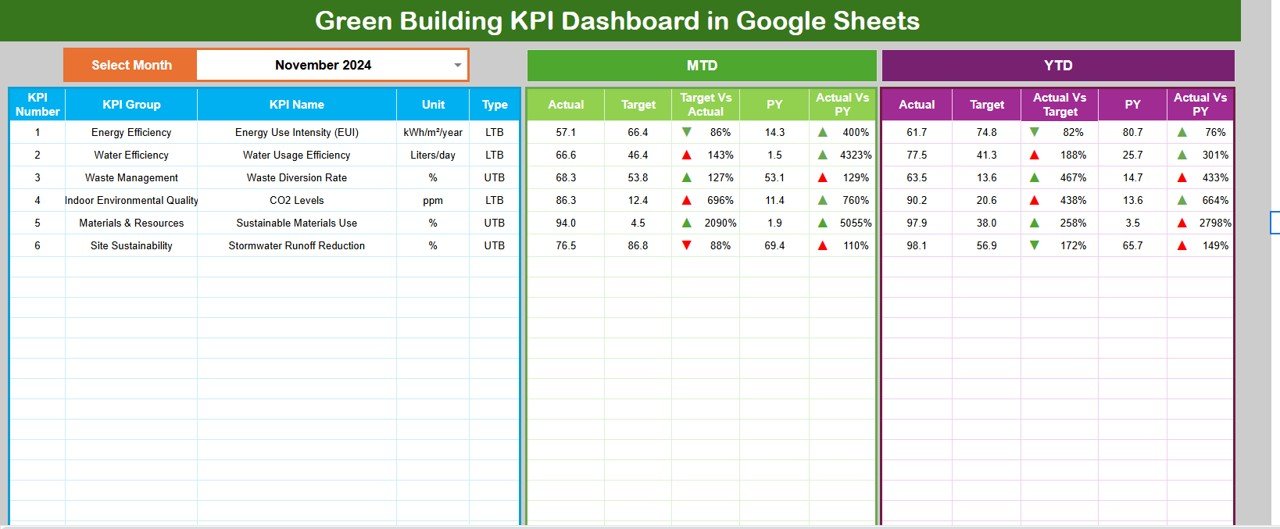
Dashboard Sheet Tab
- The Dashboard sheet is the control center.
- You can select the desired month from a dropdown in cell D3, and the entire dashboard updates automatically.
- It displays MTD Actual, Target, and Previous Year data.
- Conditional formatting with up and down arrows shows trends (Target vs Actual and PY vs Actual).
- You can also view YTD summaries with color-coded progress visuals for quick insight into overall performance.
Click to buy Green Building KPI Dashboard in Google Sheets
KPI Trend Sheet Tab
- The KPI Trend sheet allows users to analyze any KPI individually.
- You can select a KPI from a dropdown in cell C3.
- The sheet shows:
- KPI Group
- Unit of measurement
- Type (Upper the Better / Lower the Better)
- Formula used to calculate the KPI
- Definition for clear understanding
- Visual charts show monthly progress trends for each KPI.

Click to buy Green Building KPI Dashboard in Google Sheets
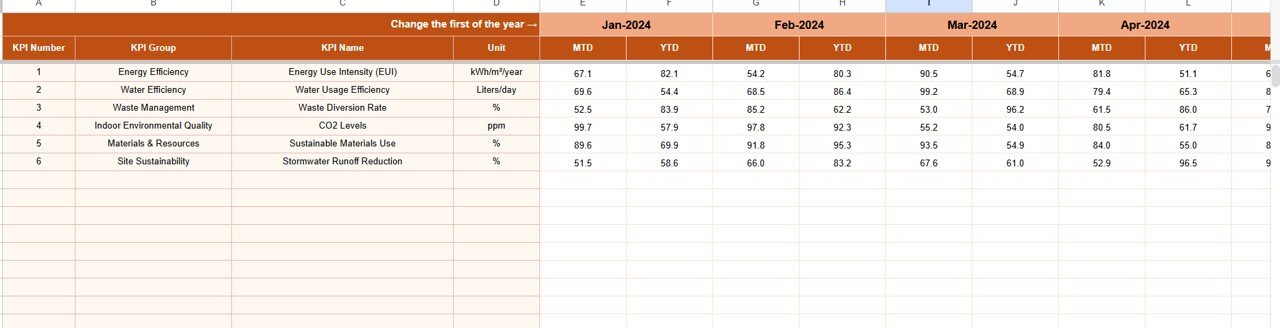
Actual Numbers Sheet Tab
- Enter actual performance data for each KPI on a monthly basis.
- Supports both MTD and YTD values.
- The month can be changed dynamically from cell E1.
- This sheet acts as the live data source for the main dashboard.
Click to buy Green Building KPI Dashboard in Google Sheets
Target Sheet Tab
- Enter target values for each KPI for every month.
- Includes separate columns for MTD and YTD targets.
- Used to calculate performance variance and visualize goal achievement.

Previous Year Numbers Sheet Tab
- Record historical performance data from the previous year.
- Enables comparison between current year and last year to evaluate improvement or decline.
KPI Definition Sheet Tab
- Contains a comprehensive list of all KPIs used in the dashboard.
- Columns include:
- KPI Name
- KPI Group
- Unit
- Formula
- Definition
- KPI Type (Upper or Lower the Better)
- This tab serves as the reference sheet for both users and analysts.
Advantages of Using a Green Building KPI Dashboard
- Enhanced Sustainability Tracking: Monitor environmental metrics easily and continuously.
- Cost Efficiency: Identify areas of high resource consumption to reduce utility costs.
- Performance Transparency: Present measurable data to stakeholders and auditors.
- Informed Decision-Making: Base operational improvements on factual KPI data.
- Automation and Accessibility: Built in Google Sheets, allowing multi-user collaboration and cloud access.
Best Practices for the Green Building KPI Dashboard
- Keep Data Updated: Enter actual values regularly to ensure reports reflect the current situation.
- Define Clear KPI Targets: Establish realistic and measurable goals for every KPI.
- Review Monthly Trends: Use the KPI Trend sheet to detect performance deviations early.
- Engage All Stakeholders: Share the dashboard link with facility teams, energy managers, and executives.
- Benchmark Annually: Compare current year data against previous year metrics for continuous improvement.
- Visualize with Colors: Maintain green-yellow-red indicators for performance categories.
Conclusion
The Green Building KPI Dashboard in Google Sheets is more than just a reporting tool — it’s a strategic solution for sustainability management. By tracking performance indicators like energy, water, and waste metrics, organizations can transform their environmental data into measurable impact.
With this easy-to-use and dynamic dashboard, sustainability performance becomes transparent, measurable, and actionable — driving your building closer to a greener future.
Frequently Asked Questions (FAQs)
- What is a Green Building KPI?
A Green Building KPI is a measurable metric that tracks a building’s sustainability performance — such as energy consumption, water usage, or recycling rates.
- Why should I use a Google Sheets dashboard for KPIs?
Google Sheets allows collaborative, cloud-based, and cost-free management of data — perfect for teams tracking sustainability metrics without expensive software.
- How often should I update the dashboard?
You should update MTD and YTD values monthly to ensure accurate trend analysis.
- Can I customize KPIs in the dashboard?
Yes, you can easily add or remove KPIs in the KPI Definition sheet and adjust formulas as needed.
- Does this dashboard support charts and visuals?
Absolutely. The Dashboard and KPI Trend sheets include dynamic charts and conditional formatting for visual insights.
Visit our YouTube channel to learn step-by-step video tutorials
Youtube.com/@NeotechNavigators
Watch the step-by-step video tutorial: