Managing accounts payable efficiently is critical for maintaining healthy cash flow, strong vendor relationships, and financial compliance. However, many finance teams still rely on scattered spreadsheets, manual tracking, and delayed reporting. As a result, payments get delayed, errors increase, and management lacks real-time visibility.Accounts Payable KPI Dashboard in Google Sheets
An Accounts Payable KPI Dashboard in Google Sheets solves these challenges by providing a ready-to-use, structured, and automated performance tracking system. It helps finance teams monitor payment efficiency, control costs, reduce overdue invoices, and improve vendor satisfaction using clearly defined KPIs.Accounts Payable KPI Dashboard in Google Sheets
What Is an Accounts Payable KPI Dashboard in Google Sheets?
Click to Buy Accounts Payable KPI Dashboard in Google Sheets
An Accounts Payable KPI Dashboard is a centralized reporting tool that tracks and analyzes all key metrics related to supplier payments and liabilities. Built in Google Sheets, this dashboard automatically converts raw AP data into meaningful insights using formulas, conditional formatting, and interactive views.Accounts Payable KPI Dashboard in Google Sheets
It helps organizations answer important questions such as:
- How fast are invoices processed?
- How many invoices are overdue?
- Are early payment discounts utilized?
- Is the AP team meeting payment targets?
- How does current performance compare with last year?
Because it is built in Google Sheets, the dashboard is cloud-based, collaborative, cost-effective, and easy to maintain.
Key Features of the Accounts Payable KPI Dashboard
This dashboard is designed with 6 structured worksheets, each serving a specific purpose in AP performance monitoring.
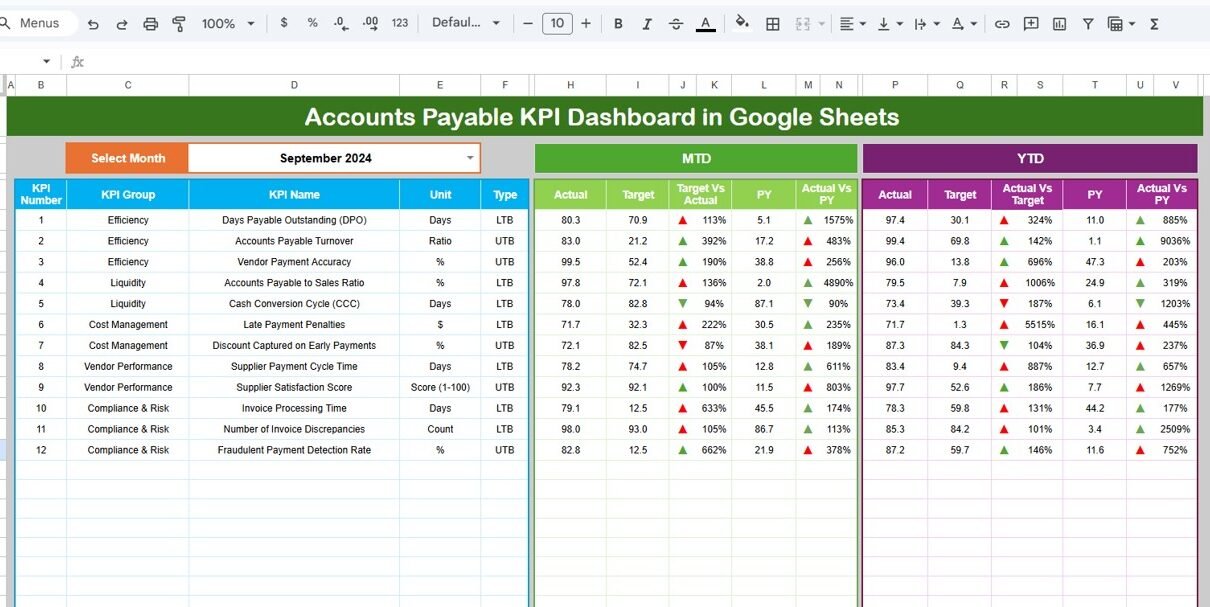
1. Dashboard Sheet Tab (Main Page)
This is the most important sheet in the dashboard. It provides a high-level summary of all Accounts Payable KPIs.
Key Functionalities
-
On cell D3, you can select the month from a dropdown.
-
Once the month is selected, all KPIs update automatically.
Metrics Displayed
For each KPI, the dashboard shows:
MTD (Month-to-Date)
-
MTD Actual
-
MTD Target
-
MTD Previous Year
-
Target vs Actual
-
Previous Year vs Actual
YTD (Year-to-Date)
-
YTD Actual
-
YTD Target
-
YTD Previous Year
-
Target vs Actual
-
Previous Year vs Actual
Visual Indicators
-
Green up arrow → Performance improved
-
Red down arrow → Performance declined
This allows finance leaders to instantly understand AP performance without reviewing raw data.

Click to Buy Accounts Payable KPI Dashboard in Google Sheets
2. KPI Trend Sheet Tab
This sheet helps analyze month-wise trends for a single KPI.
How It Works
Select a KPI name from the dropdown in cell C3.
The sheet automatically displays:
- KPI Group
- Unit of Measurement
- KPI Type (Lower the Better / Upper the Better)
- Formula
- KPI Definition
This sheet is extremely useful for:
-
Identifying seasonal payment delays
-
Tracking long-term improvement
-
Reviewing efficiency trends

Click to Buy Accounts Payable KPI Dashboard in Google Sheets
3. Actual Number Sheet Tab
This sheet is used for data entry of actual performance.
Key Points
-
Enter MTD and YTD actual values for each KPI.
-
Select the first month of the year in cell E1.
-
The structure automatically adjusts for all months.
Once values are entered, the dashboard updates automatically.

4. Target Sheet Tab
This sheet is used to define performance benchmarks.
Purpose
-
Enter MTD targets for each KPI.
-
Enter YTD targets for long-term goals.
Targets help finance teams:
-
Measure efficiency
-
Set accountability
-
Drive continuous improvement

Click to Buy Accounts Payable KPI Dashboard in Google Sheets
5. Previous Year Number Sheet Tab
This sheet stores last year’s AP performance data.
Benefits
-
Enables year-over-year comparison
-
Highlights improvement or decline
-
Supports management reviews and audits

6. KPI Definition Sheet Tab
This is the reference sheet for the entire dashboard.
Contains
-
KPI Name
-
KPI Group
-
Unit
-
Formula
-
KPI Definition
-
KPI Type (LTB / UTB)
It ensures clarity, consistency, and standard understanding across teams.

Click to Buy Accounts Payable KPI Dashboard in Google Sheets
Advantages of Accounts Payable KPI Dashboard
-
Improves payment accuracy and timeliness
-
Enhances cash flow management
-
Reduces late payment penalties
-
Strengthens vendor relationships
-
Provides real-time financial visibility
-
Supports audit and compliance needs
-
Improves AP team productivity
Opportunities for Improvement in Accounts Payable Tracking
-
Integrate with ERP systems (SAP, Oracle, NetSuite)
-
Automate invoice uploads and OCR
-
Add aging bucket analysis
-
Introduce vendor-level scorecards
-
Track fraud risk indicators
-
Add cash flow forecasting
Best Practices for Using the Accounts Payable KPI Dashboard
Click to Buy Accounts Payable KPI Dashboard in Google Sheets
-
Update invoice data daily or weekly
-
Clearly define KPI ownership
-
Review MTD KPIs weekly
-
Conduct monthly YTD performance reviews
-
Focus on reducing exceptions and duplicates
-
Align DPO targets with cash strategy
Conclusion
An Accounts Payable KPI Dashboard in Google Sheets provides a powerful, flexible, and cost-effective solution for monitoring AP performance. With clearly defined KPIs, automated calculations, and visual insights, finance teams gain full control over payables, improve efficiency, and support smarter financial decisions. This dashboard is ideal for organizations that want transparency, accountability, and continuous improvement in their accounts payable process.
Frequently Asked Questions (FAQs)
Click to Buy Accounts Payable KPI Dashboard in Google Sheets
1. Who should use this dashboard?
Finance teams, AP managers, controllers, and CFOs.
2. Can I customize KPIs?
Yes, all KPIs can be modified or extended.
3. Does it support multi-year analysis?
Yes, using the Previous Year sheet.
4. Is Google Sheets secure for financial data?
Yes, with proper access controls.
5. Can this dashboard support audits?
Yes, it provides structured and traceable KPI data.
Visit our YouTube channel to learn step-by-step video tutorials
Youtube.com/@NeotechNavigators
Watch the step-by-step video tutorial:
Click to Buy Accounts Payable KPI Dashboard in Google Sheets