Audits play a critical role in ensuring compliance, managing risk, and improving operational efficiency. However, many organizations still rely on manual reports, scattered spreadsheets, and static presentations to track audit outcomes. As a result, leadership teams struggle to identify high-risk areas, control audit costs, and monitor corrective actions effectively.
This is exactly where an Audit Findings & Risk Analysis Dashboard in Google Sheets becomes a powerful and practical solution.
This ready-to-use dashboard converts raw audit data into clear insights using interactive cards, charts, and filters. It helps auditors, compliance teams, risk managers, and leadership teams track audit performance, risk exposure, compliance scores, and costs in one centralized place.
What Is an Audit Findings & Risk Analysis Dashboard in Google Sheets?
An Audit Findings & Risk Analysis Dashboard is a structured analytical tool designed to monitor audit activities, compliance levels, risk categories, audit findings, and cost efficiency.
Instead of reviewing multiple reports, this dashboard provides:
- A consolidated view of all audits
- Risk-level analysis
- Compliance performance tracking
- High-risk findings identification
- Department and location-wise insights
- Audit cost and efficiency analysis
Because the dashboard runs entirely in Google Sheets, it remains easy to use, highly flexible, and accessible from anywhere.
Key Features of the Audit Findings & Risk Analysis Dashboard
This dashboard is a ready-to-use solution with structured pages and powerful visuals. It includes:
- Overview metrics and trends
- Risk and compliance analysis
- Department and location performance
- Findings and corrective action insights
- Cost and efficiency analysis
- Advanced search functionality
Each section works together to give a complete audit performance picture.
Overview Sheet Tab – Executive Snapshot
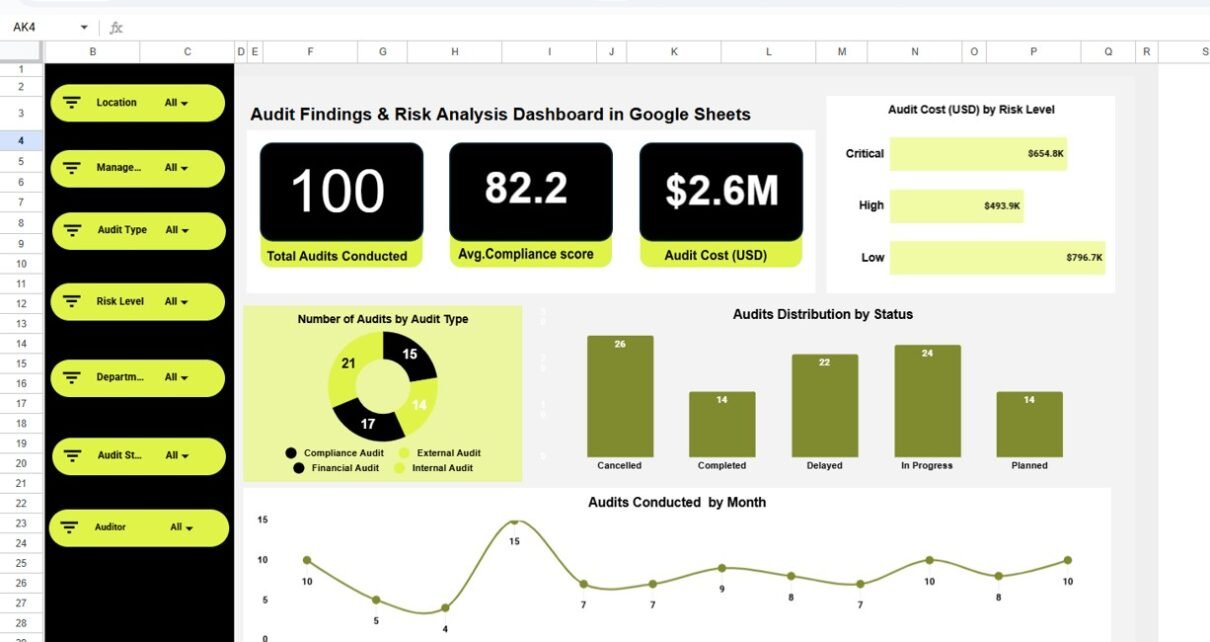
The Overview sheet acts as the main control panel for audit performance.
Key Cards on the Overview Page
-
Total Audits Conducted
Displays the total number of audits completed in the selected period. -
Average Compliance Score
Shows the overall compliance performance across all audits. -
Audit Cost (USD)
Highlights the total cost incurred for audit activities.
These cards allow decision-makers to understand audit health instantly.
Charts on the Overview Page
Audit Cost (USD) by Risk Level
Shows how audit spending distributes across low, medium, and high-risk audits.
Audits Distribution by Status
Breaks audits into categories such as completed, ongoing, and pending.
Number of Audits by Audit Type
Helps understand which audit types occur most frequently.
Audits Conducted by Month
Tracks audit activity trends over time.
This page helps leadership quickly identify workload patterns, cost drivers, and audit coverage.

Risk & Compliance Analysis
This section focuses on compliance quality and risk exposure.
Key Charts in Risk & Compliance Analysis
Average Compliance Score by Risk Level
Shows how compliance performance changes as risk increases.
Audit Cost (USD) by Risk Level
Highlights cost intensity for different risk categories.
Re-Audit Requirement Distribution
Identifies audits that require follow-up reviews.
Audit Count by Risk Level
Displays how audits distribute across risk classifications.
This section helps compliance teams prioritize high-risk areas and allocate resources effectively.

Department & Location Performance Analysis
Audits often vary by department and location. This section provides deep visibility into organizational performance.
Key Charts in Department & Location Performance
Compliance Score by Department
Reveals which departments maintain strong compliance standards.
Number of Audits by Location
Shows audit concentration across regions or offices.
Number of Audits by Department and Audit Type
Helps analyze audit focus areas within each department.
This analysis supports targeted training, policy updates, and corrective actions.

Findings & Corrective Action Analysis
Audit findings determine the real value of audits. This section highlights risk areas clearly.
Key Charts in Findings & Corrective Action
High-Risk Findings by Location
Identifies locations with critical compliance gaps.
Audit Findings by Category
Shows common issues such as policy gaps, documentation issues, or process failures.
High-Risk Findings by Department
Highlights departments requiring immediate corrective actions.
Audit Findings by Auditor
Helps review auditor effectiveness and focus areas.
This section supports risk mitigation planning and accountability.

Cost & Efficiency Analysis
Managing audit costs is essential for sustainable compliance programs.
Key Charts in Cost & Efficiency Analysis
Audit Cost (USD) by Location
Tracks regional audit spending.
Audit Cost (USD) by Auditor
Evaluates cost efficiency at the auditor level.
Audit Cost (USD) by Month
Identifies seasonal or project-based cost spikes.
This analysis helps organizations control expenses without compromising audit quality.

Search Functionality – Smart & Fast Navigation
The dashboard includes a Search by Keyword and Field Name feature.
You can search by:
- Audit ID
- Department
- Location
- Auditor
- Risk Level
- Audit Type
- Status
This functionality allows users to locate specific audits instantly, saving time during reviews, investigations, and compliance checks.

Advantages of Audit Findings & Risk Analysis Dashboard in Google Sheets
1. Centralized Audit Visibility
All audit data stays in one place.
2. Faster Risk Identification
High-risk findings become visible immediately.
3. Improved Compliance Monitoring
Compliance scores track performance clearly.
4. Better Cost Control
Audit cost analysis prevents overspending.
5. Data-Driven Decision Making
Leadership makes informed compliance decisions.
6. Easy Collaboration
Multiple teams can access the dashboard securely.
7. No Complex Software Required
Runs entirely in Google Sheets.
Opportunities for Improvement in Audit Analysis
Although the dashboard is powerful, organizations can enhance it further:
- Add SLA tracking for corrective actions
- Include automated alerts for high-risk findings
- Integrate risk scoring models
- Add year-over-year audit comparisons
- Include audit recommendation tracking
- Connect with internal compliance systems
These improvements make audit programs more proactive.
Best Practices for Using the Audit Dashboard
- Update audit data regularly
- Standardize risk and compliance definitions
- Review high-risk findings weekly
- Monitor re-audit requirements closely
- Use department insights for training planning
- Restrict access using role-based permissions
Following these practices improves audit effectiveness.
Conclusion
The Audit Findings & Risk Analysis Dashboard in Google Sheets provides a structured, visual, and efficient way to manage audits, compliance, and risk. It transforms audit data into actionable insights, helping organizations reduce risk exposure, improve compliance performance, and control audit costs.
Because the dashboard is easy to use, fully customizable, and cloud-based, it becomes an essential tool for auditors, compliance teams, risk managers, and leadership.
Frequently Asked Questions (FAQs)
1. Who should use this audit dashboard?
Internal auditors, compliance teams, risk managers, and leadership teams.
2. Can this dashboard support multiple locations?
Yes, it supports unlimited departments and locations.
3. Is it suitable for internal and external audits?
Yes, it works for both audit types.
4. Can I customize risk levels and audit types?
Yes, the dashboard is fully customizable.
5. Does it support real-time collaboration?
Yes, Google Sheets allows multi-user access.
6. Is technical knowledge required?
No, basic Google Sheets knowledge is sufficient.
Watch the step-by-step video tutorial:
Visit our YouTube channel to learn step-by-step video tutorials