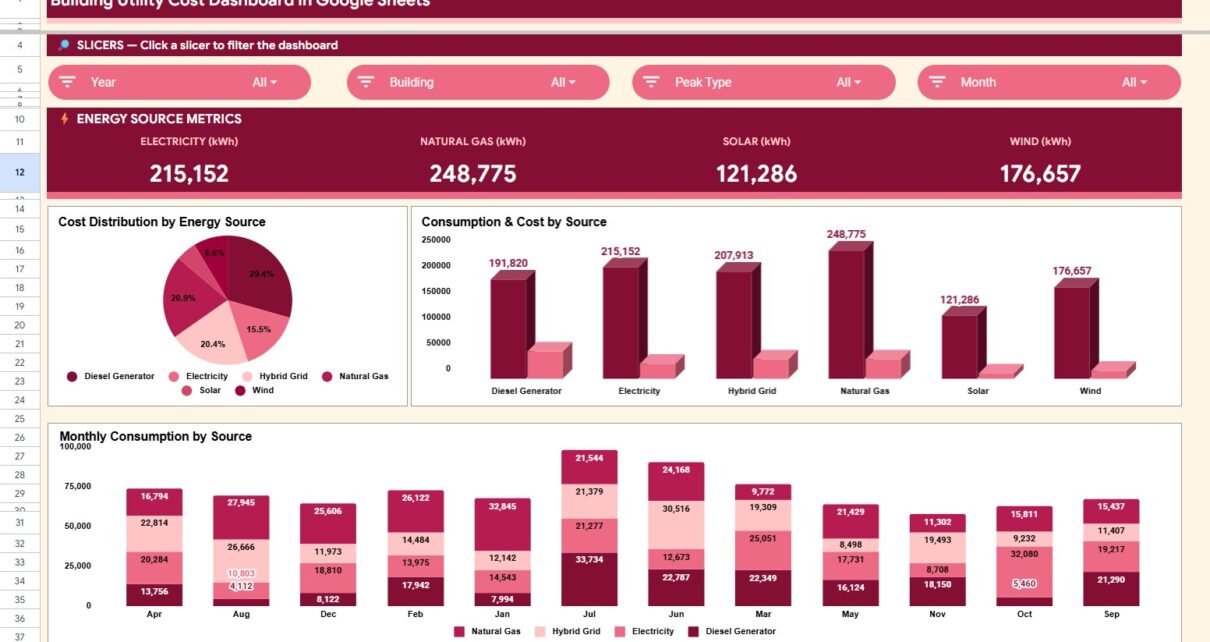
Track building utility costs in Google Sheets with Overview, Building Energy, Energy Source, Monthly Trends, Search Sheet, and Data Sheet tabs.
Online Tutorial for Data Analysis and Automation
Track building utility costs in Google Sheets with Overview, Building Energy, Energy Source, Monthly Trends, Search Sheet, and Data Sheet tabs.
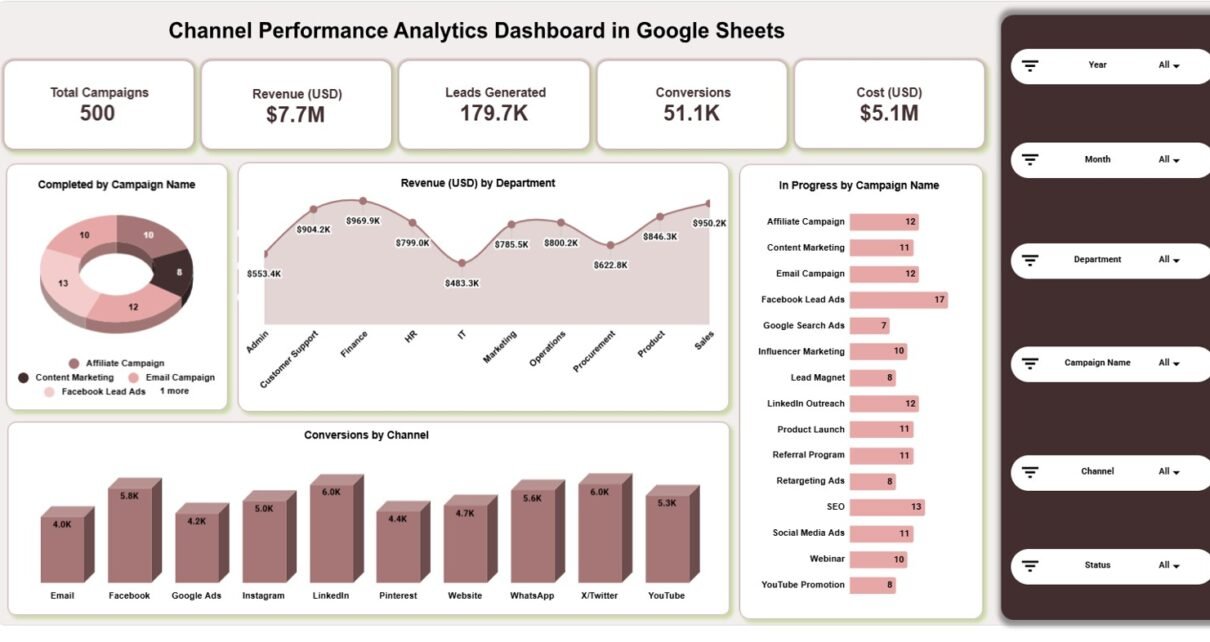
Track campaigns, channels, revenue, leads, conversions, cost, departments, and monthly trends with this Google Sheets performance analytics dashboard template.
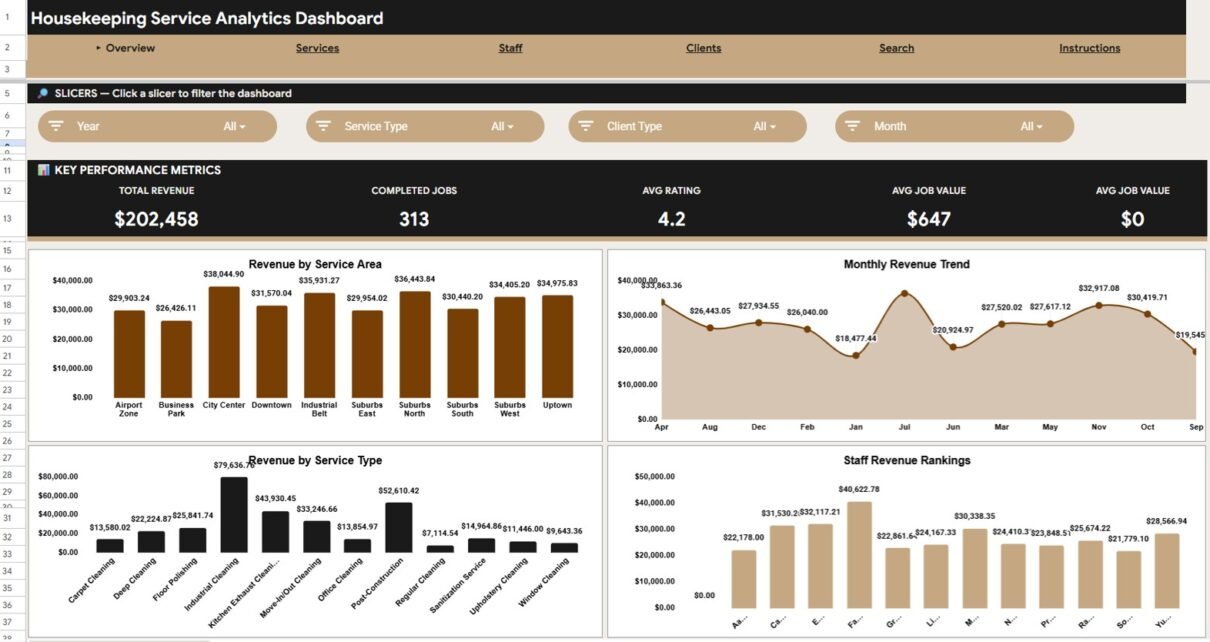
Track housekeeping revenue, completed jobs, ratings, staff output, service areas, clients, payment methods, and Job ID lookup with this Google Sheets dashboard template.
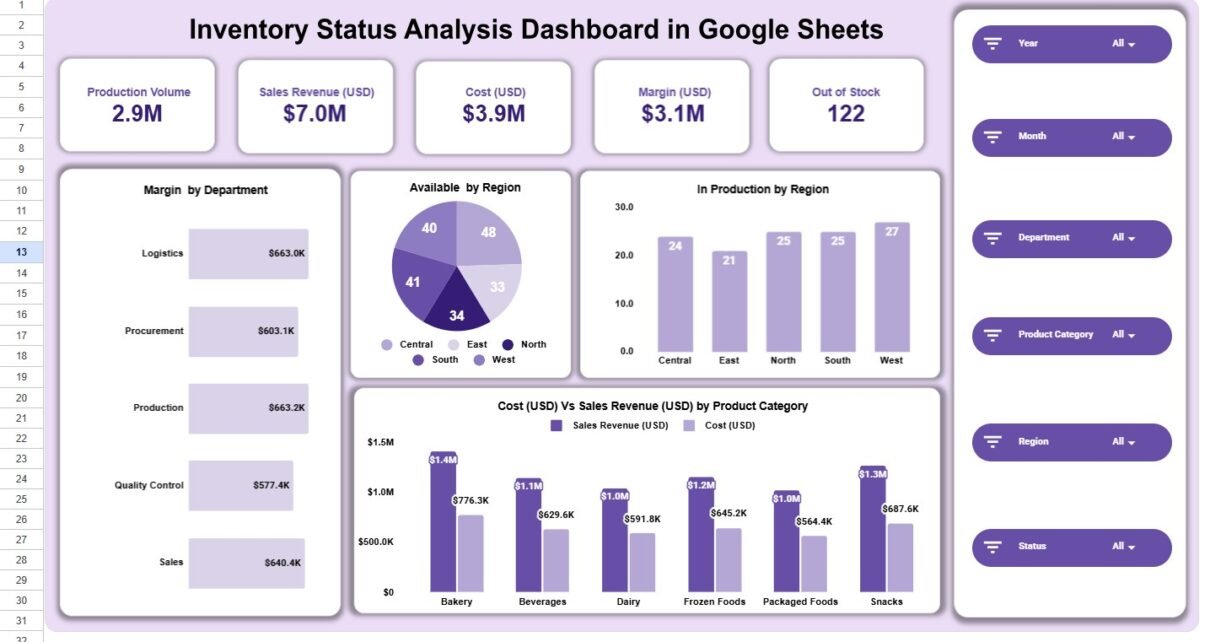
Review this Inventory Status Analysis Dashboard in Google Sheets for stock status, production, revenue, cost, margin, region, department, category, and monthly trends.
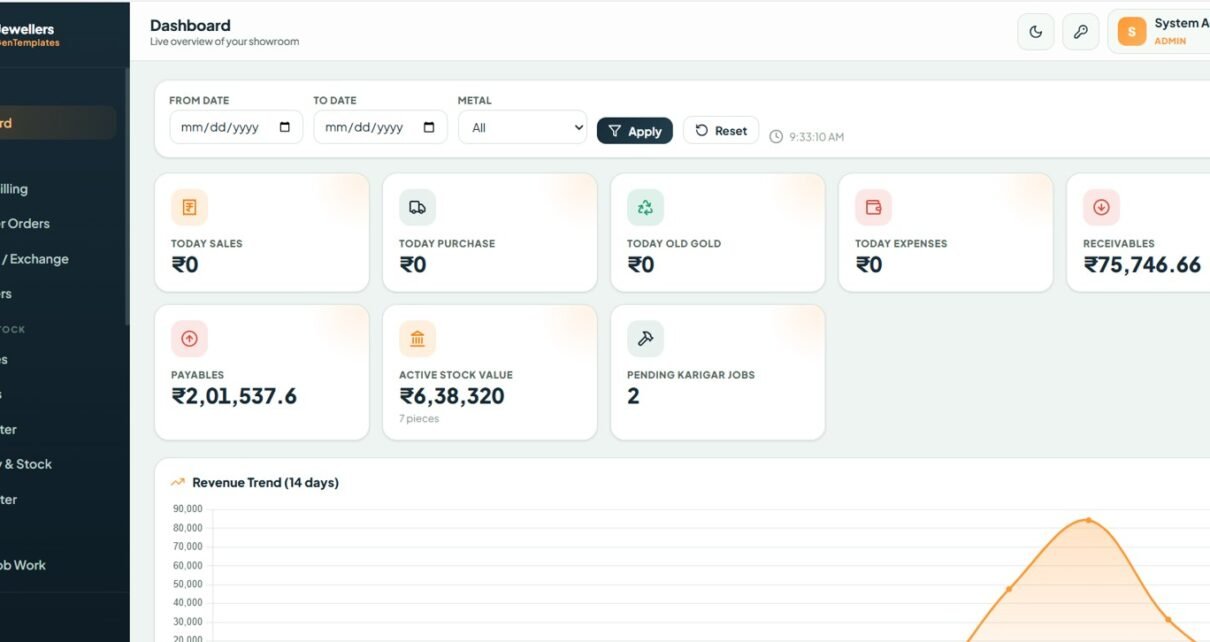
Run an entire jewellery showroom from one Google Sheets web app — sales, billing, old gold exchange, tagged inventory, karigar job work, accounts and reports across 19 connected screens with role-based login.
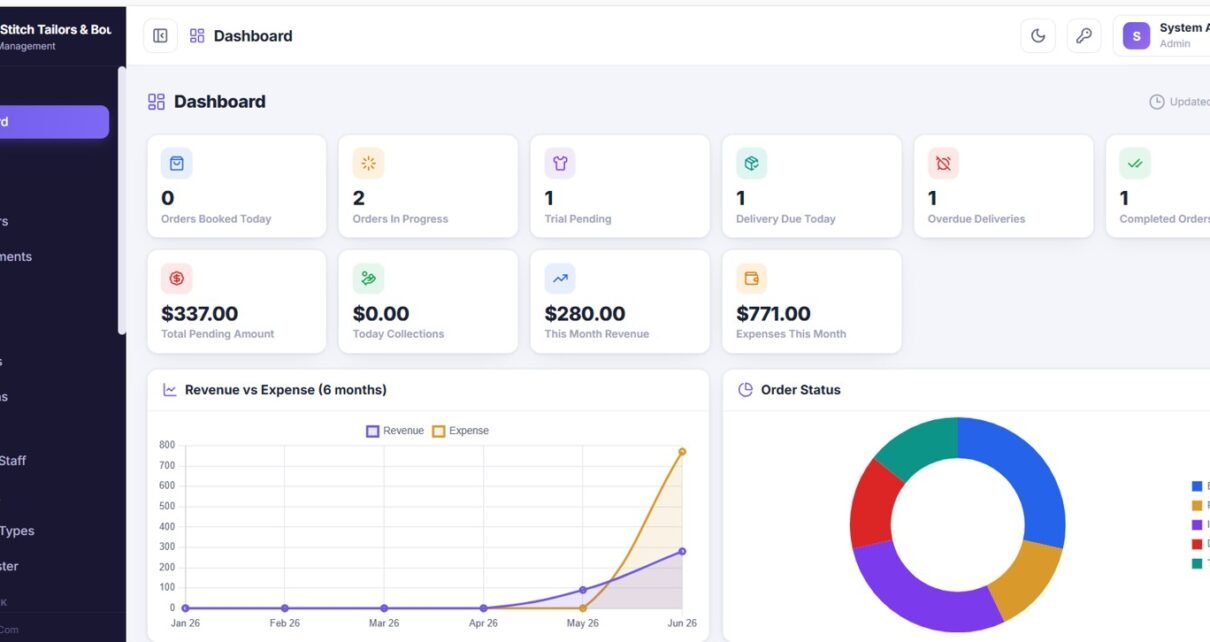
A Google Sheets and Apps Script web app that runs a tailoring shop or boutique from one place — 25 connected screens for orders, measurements, trials, billing, inventory and staff with role-based login.
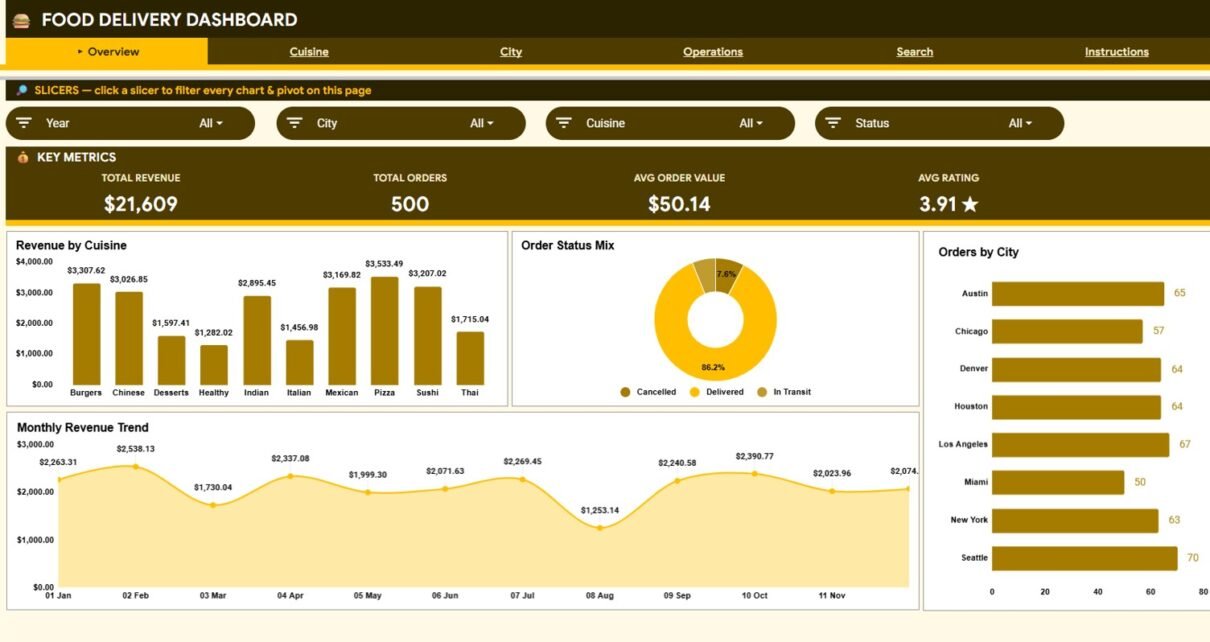
A Food Delivery Dashboard in Google Sheets that tracks 4 KPIs across 6 sheets with 17 charts, slicer filters, and instant single-order search.
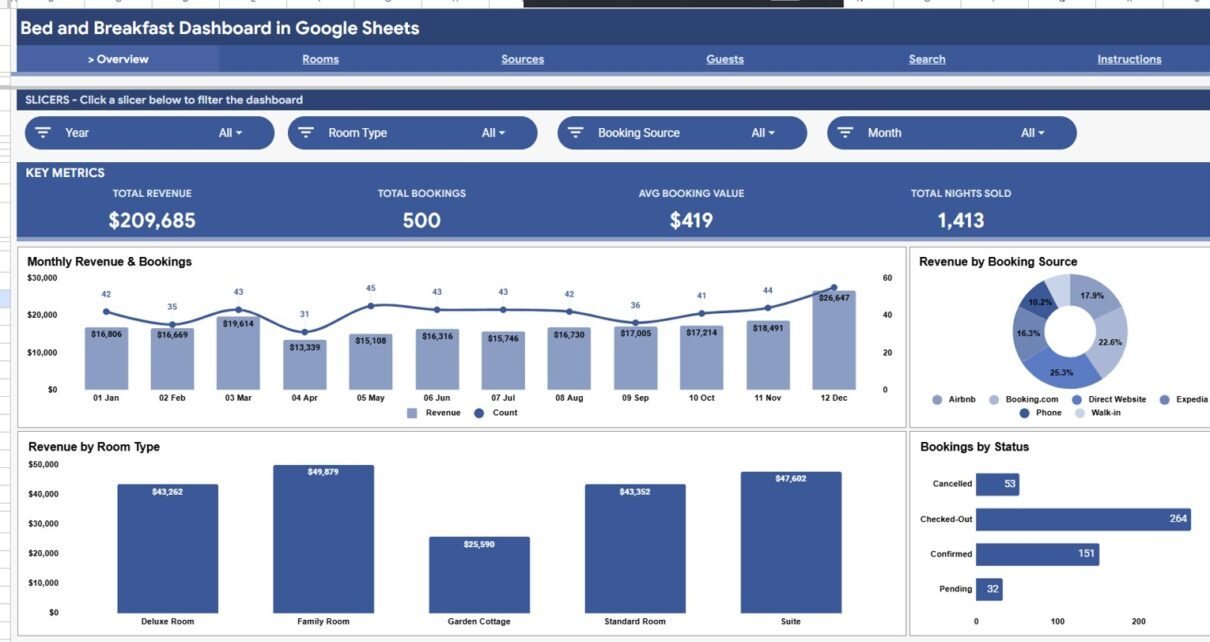
A Google Sheets dashboard for bed and breakfast owners that tracks revenue, bookings, room types, sources and guests across 4 analysis pages with slicers, 16 charts and a Booking ID search.
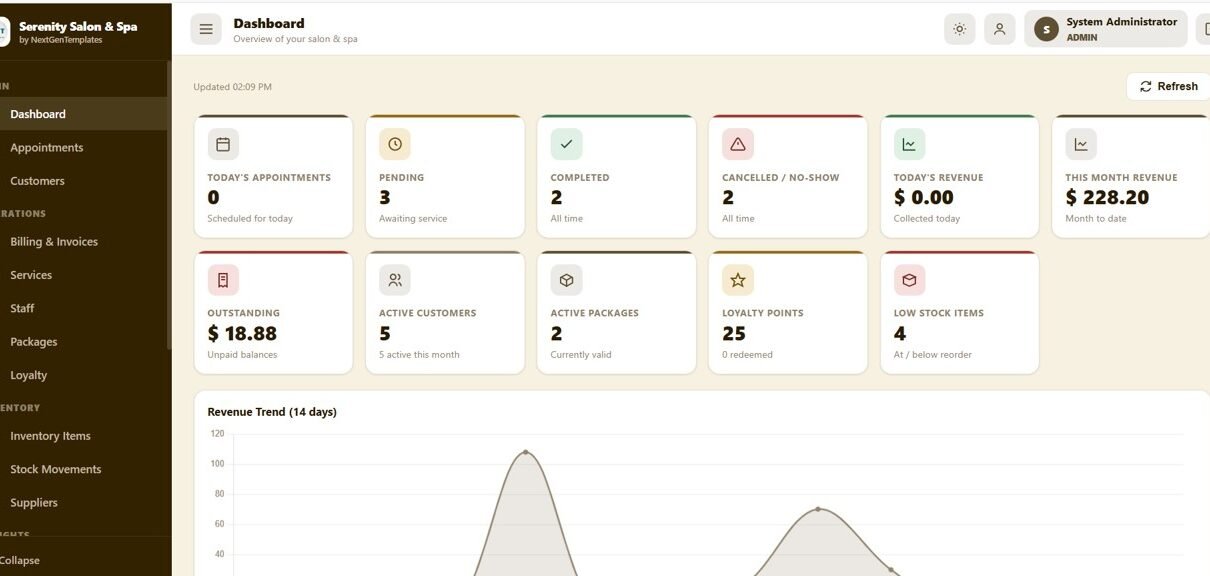
Salon and Spa Management System Web App on Google Sheets — 18 screens for appointments, billing, customers, loyalty, packages, inventory and staff. One-time $39.99, no monthly fees and no per-booking commission.
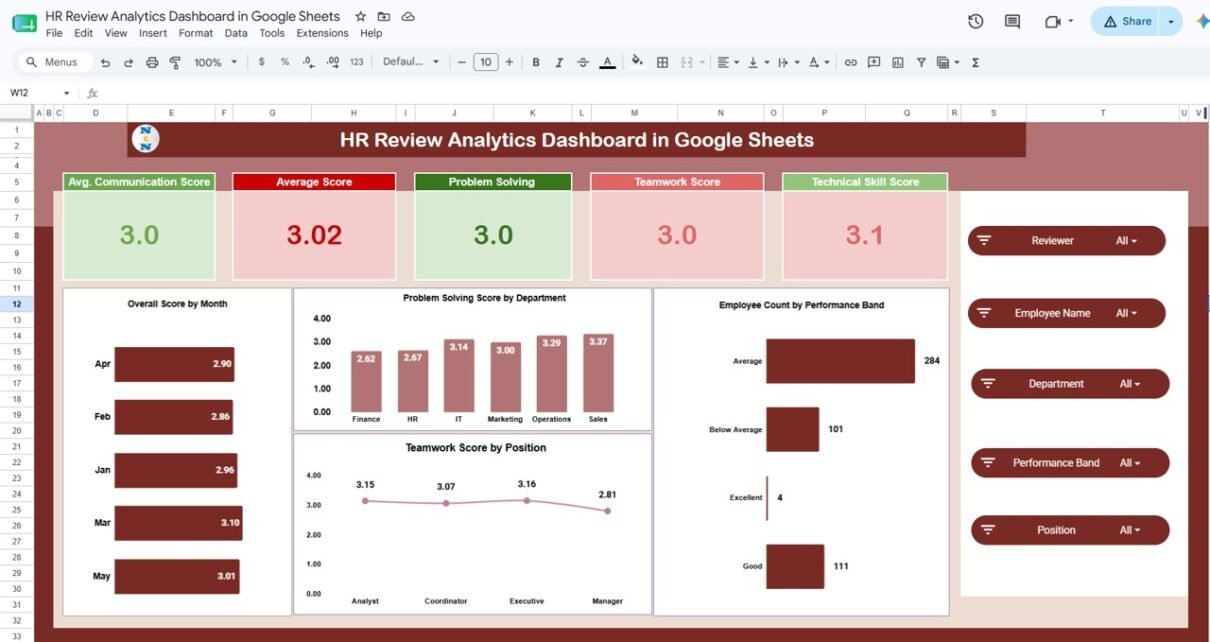
The HR Review Analytics Dashboard in Google Sheets turns raw appraisal scores into 19 interactive charts across 7 tabs — track communication, problem solving, teamwork, technical skill, and punctuality by reviewer, position, department, and month.