If you’ve ever needed to find the average of a set of data based on multiple conditions in Google Sheets, then the AVERAGEIFS Function in Google Sheets is your go-to solution. This powerful function allows you to average values in a range that meet specific criteria across multiple columns. Sounds complicated? Don’t worry; we’re here to simplify it with an easy-to-follow example!
What is the AVERAGEIFS Function?
The AVERAGEIFS function in Google Sheets calculates the average of a range of numbers, but only for those that meet one or more criteria. It’s like having a filter that only lets through the values you care about.
Here’s the syntax of the AVERAGEIFS function:
=AVERAGEIFS(average _range, criteria_range1, criterion1, [criteria_range2, criterion2], …)
- average _range: The range of values you want to average.
- criteria_range1: The range where your first condition is located.
- criterion1: The specific condition that must be met in the first range.
- criteria_range2: (Optional) The range where your second condition is located.
- criterion2: (Optional) The specific condition for the second range.
Example Data Setup
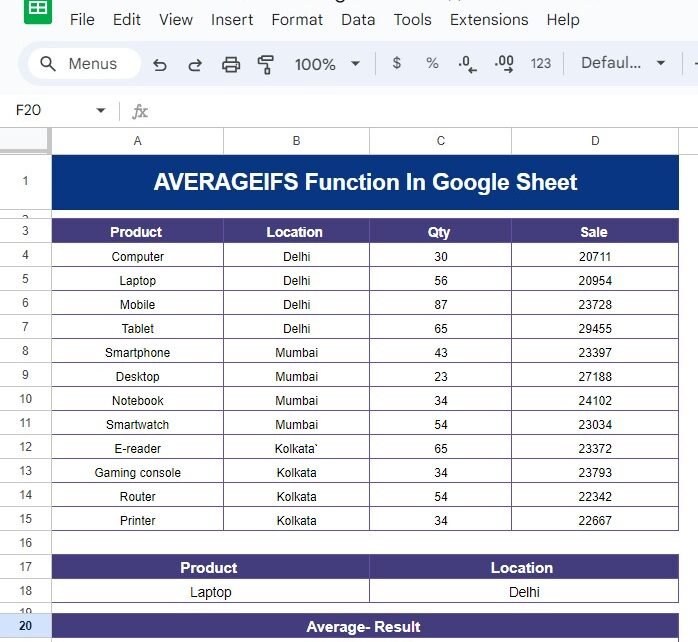
Let’s dive into an example to see how this works in practice. Imagine we have the following product data in cells A3 to D15:
Now, let’s say you want to calculate the average of the quantities, but only for products located in Delhi. This is where the AVERAGEIFS function comes in handy.

Applying the AVERAGEIFS Formula
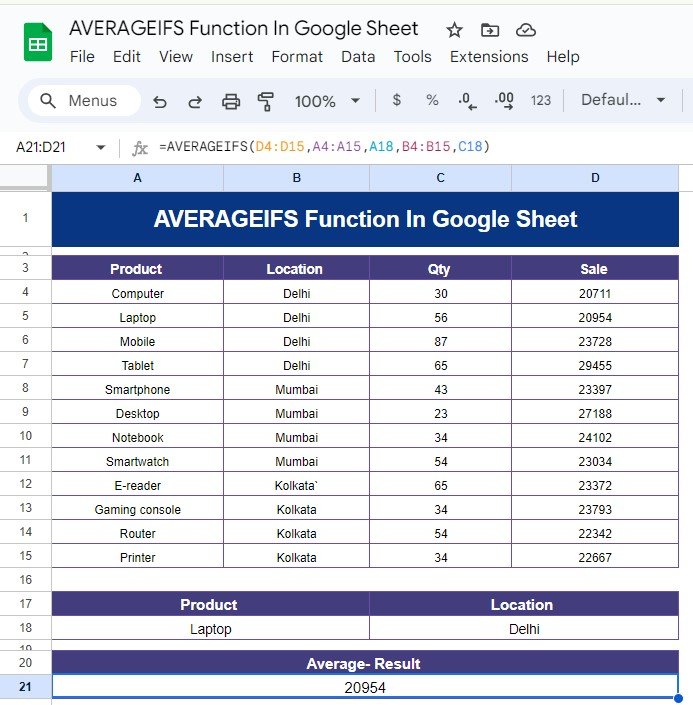
We want to find the average quantity for the products located in “Delhi”. To do this, we use the following formula:
=AVERAGEIFS(D4:D15, A4:A15, "Delhi")
Here’s what this formula does:
- D4:D15: This is the range we want to average (the quantities).
- A4:A15: This is the range where the first condition will be checked (the product locations).
- “Delhi”: This is the condition; we only want to include rows where the location is “Delhi.”
The result of this formula will be the average quantity of products in Delhi, which turns out to be 59.5.
Breaking Down the Formula
Let’s break it down a bit further:
The AVERAGEIFS function first looks at the range A4
to find rows where the location is “Delhi.”
Once it finds those rows, it averages the corresponding values from the range D4
(the quantities).
The final result is the average of the quantities for products located in Delhi.
Why Use AVERAGEIFS?
Now that you’ve seen the function in action, you might wonder why it’s so useful. Here are some key benefits:
- Multiple Conditions: AVERAGEIFS can handle more than one condition, making it a versatile tool for more complex data analysis.
- Dynamic Filtering: It’s perfect for dynamically calculating averages based on real-time data changes.
- Accurate Analysis: You get precise results by specifying conditions, which ensures you’re only averaging the data that matters.
Practical Application
Imagine you’re managing a product inventory across multiple locations, and you want to know the average stock levels for a particular city. The AVERAGEIFS function allows you to quickly isolate the data for that city and calculate the average stock, all with just a single formula.
Try It Yourself!
Give it a try on your own Google Sheets. You’ll be surprised how easy and effective it is once you get the hang of it. Whether you’re working with sales data, inventory, or performance metrics, AVERAGEIFS can streamline your workflow and help you make data-driven decisions in no time.
Visit our YouTube channel to learn step-by-step video tutorials
Youtube.com/@NeotechNavigators
View this post on Instagram