The biotechnology industry operates in a highly data-intensive environment where research investments, clinical trials, regulatory approvals, and operational costs must remain carefully monitored. Organizations continuously analyze multiple projects across departments, regions, and development phases. However, many biotech companies still depend on static spreadsheets and manual reports, which makes performance tracking slow and inefficient.
Therefore, businesses require a smarter and more structured analytical solution. The Biotechnology Dashboard in Google Sheets provides a powerful, cloud-based system that transforms complex biotechnology data into clear visual insights.
In this article, we will explain the Biotechnology Dashboard in Google Sheets, its structure, features, analytical capabilities, advantages, best practices, and how organizations can use it to improve strategic decision-making.
What Is a Biotechnology Dashboard in Google Sheets?
A Biotechnology Dashboard in Google Sheets is an interactive reporting solution designed to monitor biotechnology operations, research investments, and project performance using visual analytics.
Instead of reviewing multiple reports separately, decision-makers can analyze all critical metrics in a single dashboard.
The dashboard tracks:
- Research & Development costs
- Clinical trial expenses
- Regulatory filing costs
- Project approval status
- Department performance
- Regional investment distribution
- Monthly performance trends
Because Google Sheets operates in the cloud, teams collaborate and update data in real time.
Why Do Biotechnology Organizations Need a Dashboard?
Click to Buy Biotechnology Dashboard in Google Sheets
Biotechnology companies manage long project lifecycles and high financial investments. Without structured analytics, leaders cannot easily evaluate project efficiency or cost performance.
A biotechnology dashboard helps organizations:
- Monitor research spending
- Track clinical trial progress
- Analyze regulatory costs
- Evaluate project approvals
- Improve financial planning
- Support data-driven strategy
As a result, organizations reduce risks and optimize investments.
Key Features of Biotechnology Dashboard in Google Sheets
This ready-to-use dashboard includes five analytical pages, each designed to answer a specific business question.
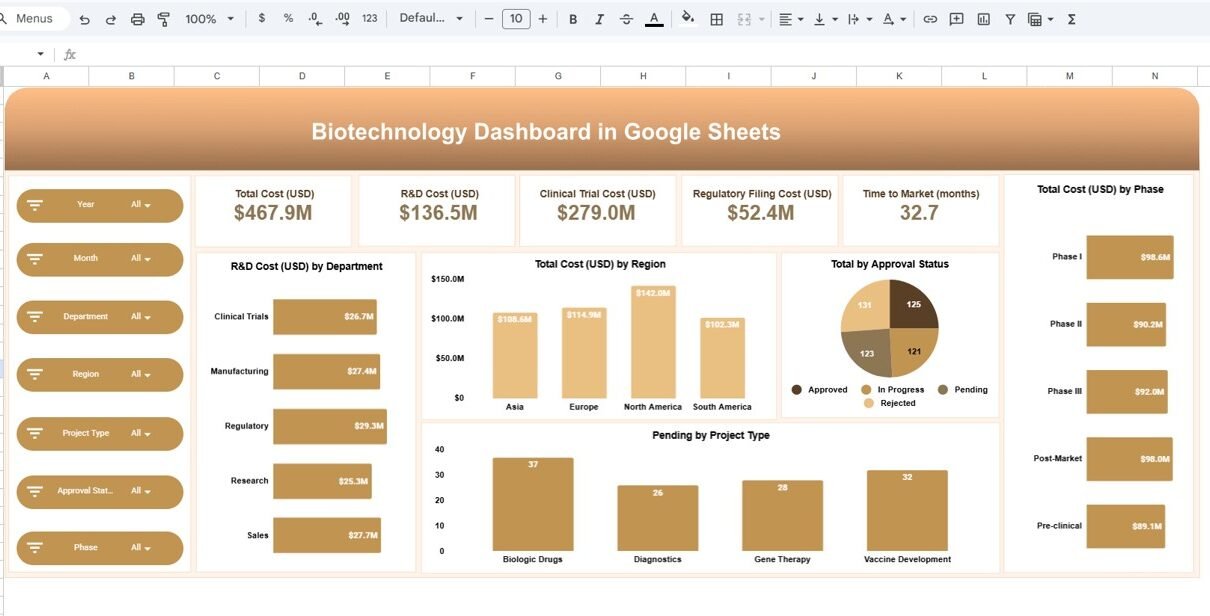
1. Overview Dashboard – How Is Overall Performance?
The Overview Page provides a high-level snapshot of biotechnology operations.
KPI Cards Displayed
- Total Cost (USD): $467.9M
- R&D Cost (USD): $136.5M
- Clinical Trial Cost (USD): $279.0M
- Regulatory Filing Cost (USD): $52.4M
- Time to Market: 32.7 months
These KPIs immediately show financial performance and development efficiency.
Charts Included
- R&D Cost by Department
- Total Cost by Region
- Approval Status Distribution
- Pending Projects by Type
- Total Cost by Phase
Therefore, executives quickly understand investment allocation.

Click to Buy Biotechnology Dashboard in Google Sheets
2. Department Analsis – Which Departments Drive Costs?
The Department Analysis page evaluates operational spending across departments.
Key Visualizations
- Clinical Trial Cost by Department
- Regulatory Filing Cost by Department
- Approved Projects by Department

Click to Buy Biotechnology Dashboard in Google Sheets
3. Region Analysis – Where Are Investments Concentrated?
Regional insights help organizations understand global performance.
Charts Displayed
- Clinical Trial Cost by Region
- Regulatory Filing Cost by Region
- Approved Projects by Region
Organizations use this page to:
- Compare regional investments
- Identify profitable markets
- Support expansion planning
Therefore, geographic decision-making becomes data-driven.

Click to Buy Biotechnology Dashboard in Google Sheets
4. Project Analysis – Which Project Types Perform Best?
Biotechnology companies run multiple project types simultaneously.
Charts Included
- Clinical Trial Cost by Project Type
- Regulatory Filing Cost by Project Type
- Approved Projects by Project Type

Click to Buy Biotechnology Dashboard in Google Sheets
5. Monthly Trends – How Does Performance Change Over Time?
Trend analysis enables forecasting and planning.
Charts Displayed
- Clinical Trial Cost by Month
- Regulatory Filing Cost by Month
- Approved Projects by Month
Because trends reveal patterns, teams predict future investments more accurately.

Click to Buy Biotechnology Dashboard in Google Sheets
Advantages of Biotechnology Dashboard in Google Sheets
Centralized Analytics
-
All biotech KPIs in one dashboard
-
Reduced reporting complexity
-
Faster insights
Real-Time Collaboration
-
Cloud-based access
-
Multi-user updates
-
Instant sharing
Improved Financial Control
-
Monitor R&D spending
-
Track regulatory costs
-
Analyze investment efficiency
Better Decision-Making
-
Visual performance insights
-
Quick comparison analysis
-
Strategic planning support
Cost-Effective BI Solution
-
No expensive software required
-
Easy implementation
Best Practices for the Biotechnology Dashboard in Google Sheets
Click to Buy Biotechnology Dashboard in Google Sheets
Define Clear KPIs
Track measurable research and financial metrics.
Maintain Data Accuracy
Update operational data regularly.
Use Consistent Categories
Standardize departments, regions, and project types.
Focus on Trends
Analyze long-term performance instead of single snapshots.
Optimize Dashboard Layout
Highlight critical KPIs at the top.
How Does This Dashboard Improve Strategic Planning?
The Biotechnology Dashboard supports strategic decisions by:
- Identifying cost inefficiencies
- Monitoring project success rates
- Optimizing research investment
- Improving approval planning
- Forecasting development timelines
As a result, companies align research strategy with financial performance.
Conclusion
Click to Buy Biotechnology Dashboard in Google Sheets
The Biotechnology Dashboard in Google Sheets transforms complex biotechnology data into actionable insights. Instead of relying on manual reporting, organizations gain interactive analytics across departments, regions, project types, and time periods.
With five analytical pages — Overview, Department Analysis, Region Analysis, Project Analysis, and Monthly Trends — decision-makers achieve complete visibility into operational and financial performance.
Ultimately, this dashboard helps biotechnology organizations improve efficiency, control costs, and accelerate innovation through data-driven decisions.
Frequently Asked Questions (FAQs)
What is a Biotechnology Dashboard?
It is an analytical dashboard that tracks research, clinical trials, and financial performance using visual metrics.
Why use Google Sheets for biotech dashboards?
Google Sheets enables collaboration, automation, and easy cloud access.
Can the dashboard be customized?
Yes, users can modify KPIs, charts, and categories easily.
What are the main KPIs tracked?
R&D cost, clinical trial cost, regulatory cost, approvals, and time to market.
Who benefits most from this dashboard?
Biotech managers, analysts, and executives responsible for research and financial decisions.
Visit our YouTube channel to learn step-by-step video tutorials
Youtube.com/@NeotechNavigators
Watch the step-by-step video tutorial: