The Broadcasting KPI Dashboard in Google Sheets is an essential tool for monitoring and optimizing broadcasting performance. From audience engagement to content delivery efficiency, this dashboard helps broadcasting companies track key metrics and make data-driven decisions.
In this article, we will explore the Broadcasting KPI Dashboard in Google Sheets, its key features, the KPIs it tracks, and how it can help improve broadcasting operations and profitability.
Key Features of the Broadcasting KPI Dashboard in Google Sheets
Below are the key features of this KPI dashboard template:
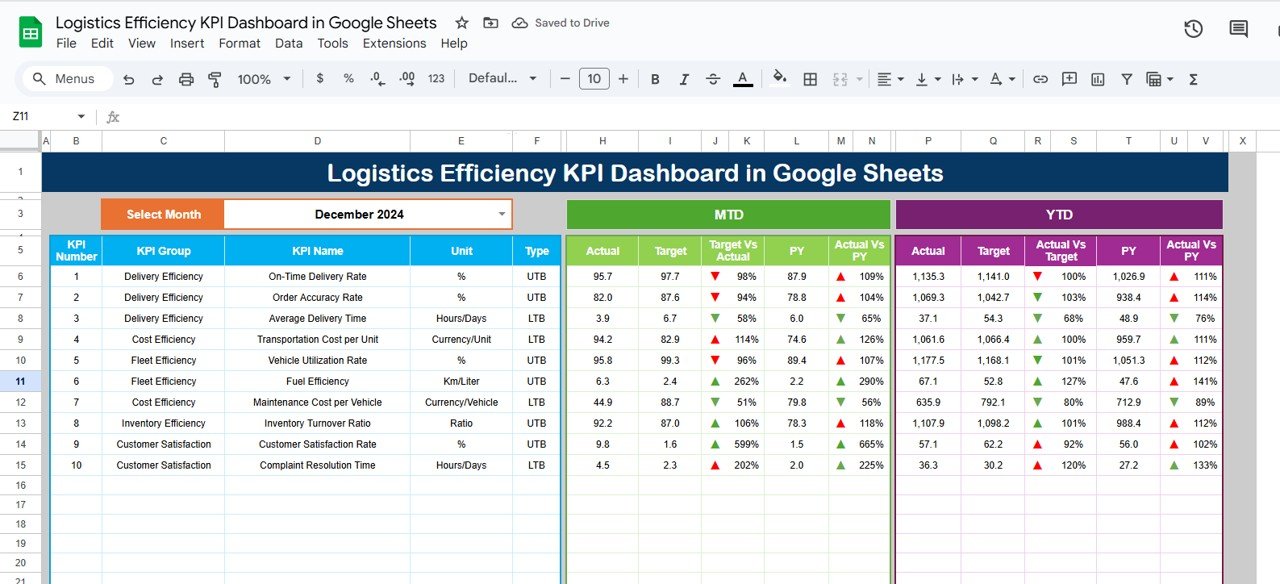
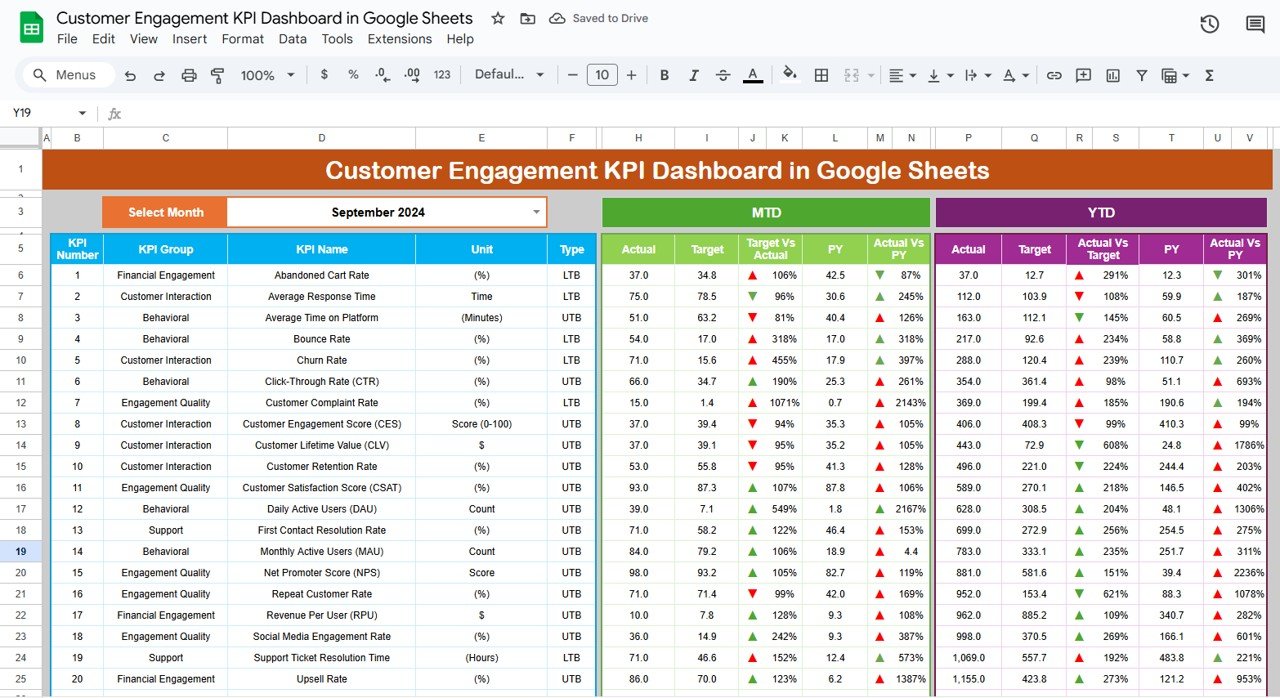
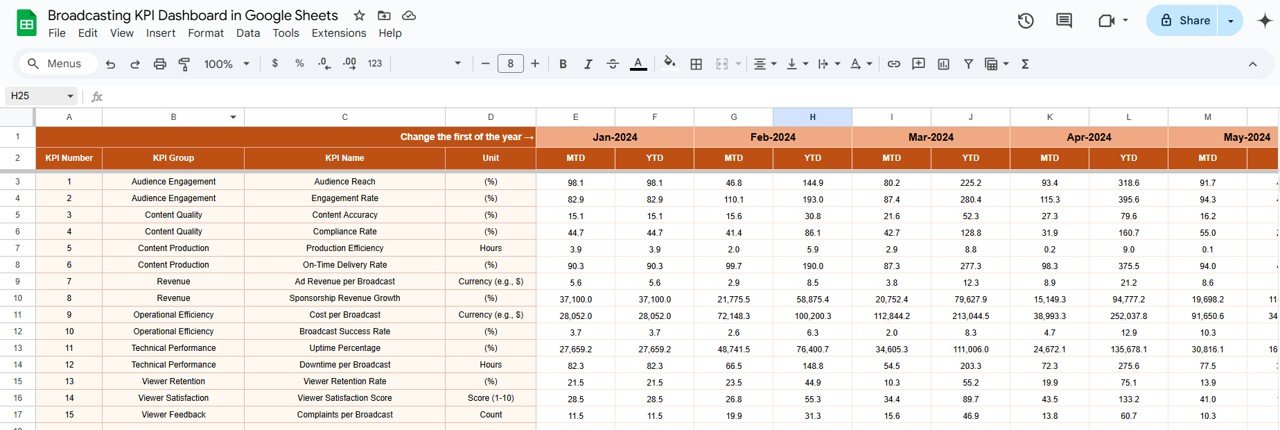
1. Dashboard Sheet Tab
This is the main sheet where all KPI data is displayed.
-
Month Selection: In Range D3, select the month from the drop-down menu, and the dashboard will update to show data for that month.
-
MTD (Month-to-Date): Displays actual numbers, target values, and comparisons with previous year data using conditional formatting (up or down arrows).
-
YTD (Year-to-Date): Shows cumulative performance with comparisons to target and previous year data.

Click to buy Broadcasting KPI Dashboard in Google Sheets
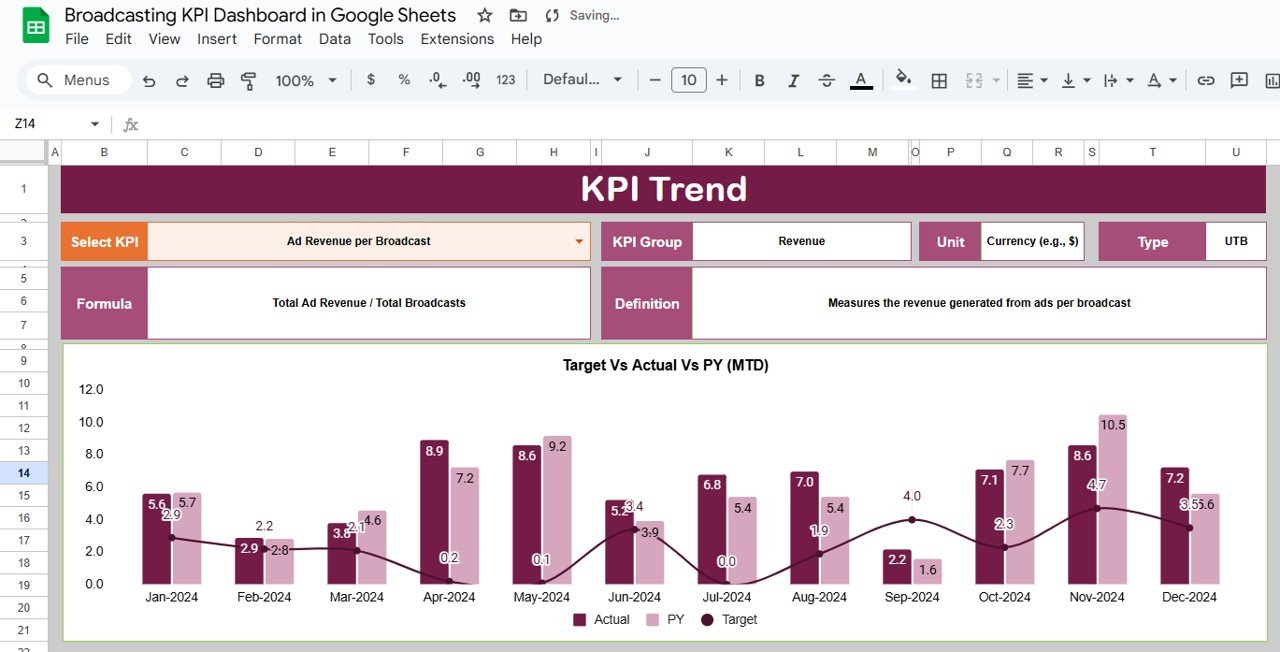
2. KPI Trend Sheet Tab
-
Select KPIs from the dropdown in Range C3.
-
Displays KPI group, unit of measure, type (Lower the Better or Upper the Better), formula, and KPI definition.
Click to buy Broadcasting KPI Dashboard in Google Sheets
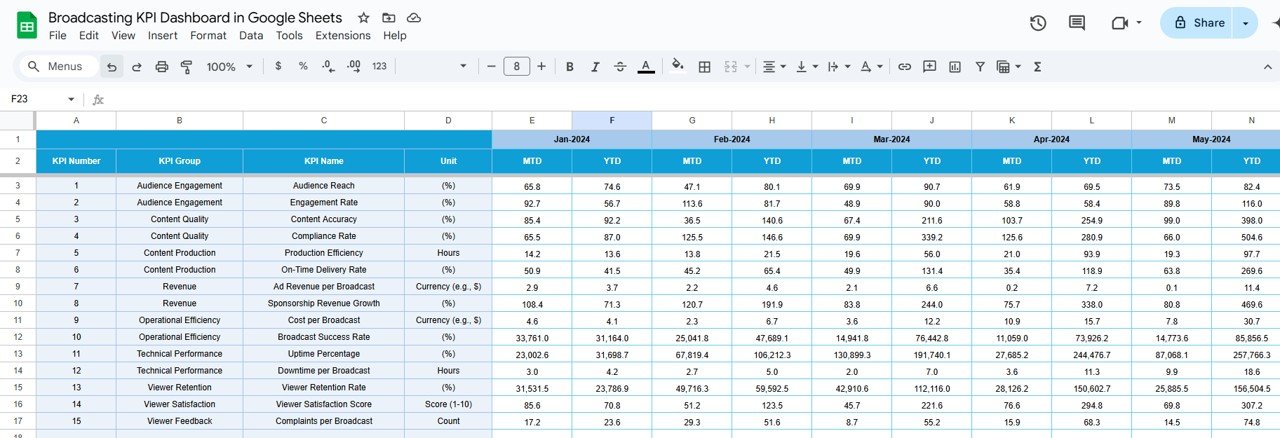
3. Actual Number Sheet Tab
-
Input actual numbers for MTD and YTD for the selected month.
-
The month selection is available in Range E1, where you input the first month of the year.
4. Target Sheet Tab
Click to buy Broadcasting KPI Dashboard in Google Sheets
-
Enter target values for each KPI for MTD and YTD.
-
Helps track performance against the set goals.
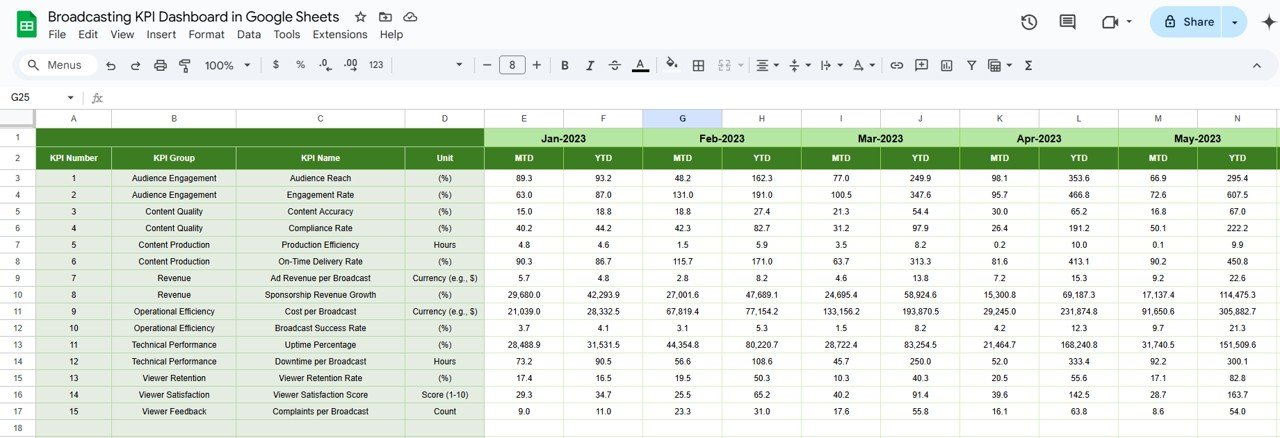
5. Previous Year Number Sheet Tab
-
Enter previous year’s data for year-over-year comparisons.
-
This data should be entered in the same format as the current year to maintain consistency.
Click to buy Broadcasting KPI Dashboard in Google Sheets
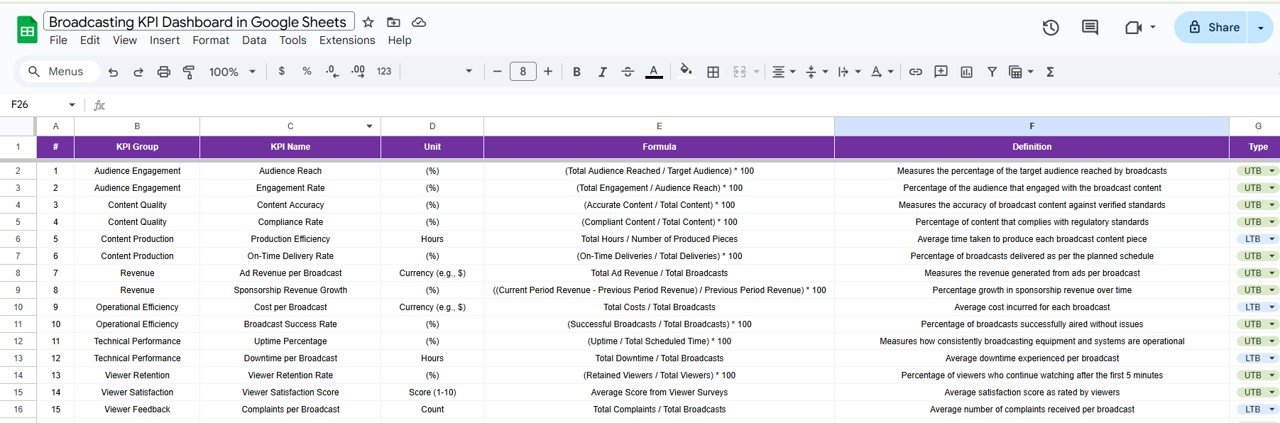
6. KPI Definition Sheet Tab
This sheet contains detailed information for each KPI, including:
- KPI Name
- KPI Group
- Unit of Measure
- Formula for KPI Calculation
- Definition of the KPI
Advantages of Using the Broadcasting KPI Dashboard in Google Sheets
Click to buy Broadcasting KPI Dashboard in Google Sheets
- The Broadcasting KPI Dashboard in Google Sheets offers several benefits to broadcasting companies:
-
Real-Time Tracking: Monitor key KPIs in real-time and make quick adjustments to improve performance.
-
Customizable: Tailor the dashboard to your specific KPIs, adjusting formulas and data sources as needed.
-
Cost-Effective: Google Sheets is a free tool, making it an affordable solution for broadcasters to track performance.
-
Collaboration: Share the dashboard with your team to work collaboratively on improving broadcasting strategies and performance.
-
Accessibility: Access the dashboard from any device with internet connectivity, ensuring you can monitor performance anywhere.
Opportunities for Improvement in the Broadcasting KPI Dashboard
While the Broadcasting KPI Dashboard in Google Sheets is effective, there are opportunities for improvement:
Automating Data Entry:
- Current Challenge: Manual data entry can be time-consuming and error-prone.
- Opportunity: Integrate the dashboard with broadcasting analytics systems to automate data entry, reducing errors and saving time.
Advanced Visualizations:
- Current Challenge: Basic visualizations may not provide in-depth insights.
- Opportunity: Add advanced charts, heatmaps, or interactive graphs to provide more detailed insights into trends and performance.
Customizable Reporting:
- Current Challenge: The dashboard offers basic reporting features.
- Opportunity: Add customizable reporting options, such as automated email reports or PDF exports, to provide tailored insights.
Best Practices for Using the Broadcasting KPI Dashboard
Click to buy Broadcasting KPI Dashboard in Google Sheets
- To get the most out of the Broadcasting KPI Dashboard in Google Sheets, consider these best practices:
-
Regularly Update Data: Keep the data up to date to ensure real-time tracking and decision-making.
-
Set Realistic Targets: Use historical data and industry standards to set achievable KPIs for broadcasting operations.
-
Review Trends: Analyze KPI trends to identify performance bottlenecks and opportunities for growth.
-
Collaborate Across Teams: Share the dashboard with key departments, such as marketing, production, and sales, to optimize overall broadcasting performance.
-
Leverage Conditional Formatting: Use color coding or arrows to highlight performance trends and quickly identify areas needing attention.
Conclusion
The Broadcasting KPI Dashboard in Google Sheets is a valuable tool for tracking and optimizing key metrics in broadcasting. By monitoring KPIs such as audience reach, content engagement, and ad revenue, broadcasters can improve their operations and profitability. This dashboard empowers decision-makers to make informed, data-driven choices to optimize their broadcasting strategy.
Frequently Asked Questions (FAQs)
Click to buy Broadcasting KPI Dashboard in Google Sheets
What is a KPI in broadcasting?
A KPI (Key Performance Indicator) in broadcasting is a measurable value used to evaluate the success of broadcasting activities. Common KPIs include audience reach, ad revenue, and viewer retention.
How do I customize my Broadcasting KPI Dashboard?
You can easily customize the dashboard by adding or removing KPIs, adjusting formulas, and modifying data sources to align with your broadcasting goals.
How do I enter data into the Broadcasting KPI Dashboard?
Simply input actual numbers for MTD and YTD in the relevant sheets (Actual Numbers Sheet, Target Sheet, Previous Year Numbers Sheet) for each month.
Can I automate data entry?
Yes, you can integrate the dashboard with external systems to automate data entry, improving accuracy and efficiency.
Which KPIs should I track in broadcasting?
Key KPIs for broadcasting include audience reach, content engagement rate, ad revenue, and cost per thousand impressions.
Visit our YouTube channel to learn step-by-step video tutorials
Youtube.com/@NeotechNavigators
Watch the step-by-step video Demo: