Every business wants to control its spending, reduce financial surprises, and stay aligned with planned budgets. However, most companies still track monthly spending manually in spreadsheets, emails, or scattered documents. Because of this, financial teams lose clarity, overspend unintentionally, and fail to monitor budget deviations on time.
A Budget Adherence KPI Dashboard in Google Sheets solves all these issues. It organizes your budget data, automates KPI calculations, and provides a clear financial picture month after month. With simple dropdowns, clean visuals, and structured worksheets, users save time and make better financial decisions.
What Is a Budget Adherence KPI Dashboard in Google Sheets?
A Budget Adherence KPI Dashboard in Google Sheets tracks all major financial KPIs that measure how closely your business follows planned budgets. It converts raw financial numbers into KPI cards, percentage comparisons, trend views, and interactive reports.
Users select any month from a dropdown, and the dashboard updates the MTD (Month-to-Date) and YTD (Year-to-Date) KPIs instantly. This makes budget monitoring fast, accurate, and simple for finance teams.
Key Features of the Budget Adherence KPI Dashboard in Google Sheets
Click to Buy Budget Adherence KPI Dashboard in Google Sheets
This dashboard contains 6 structured worksheets that work together to create a smooth reporting system.
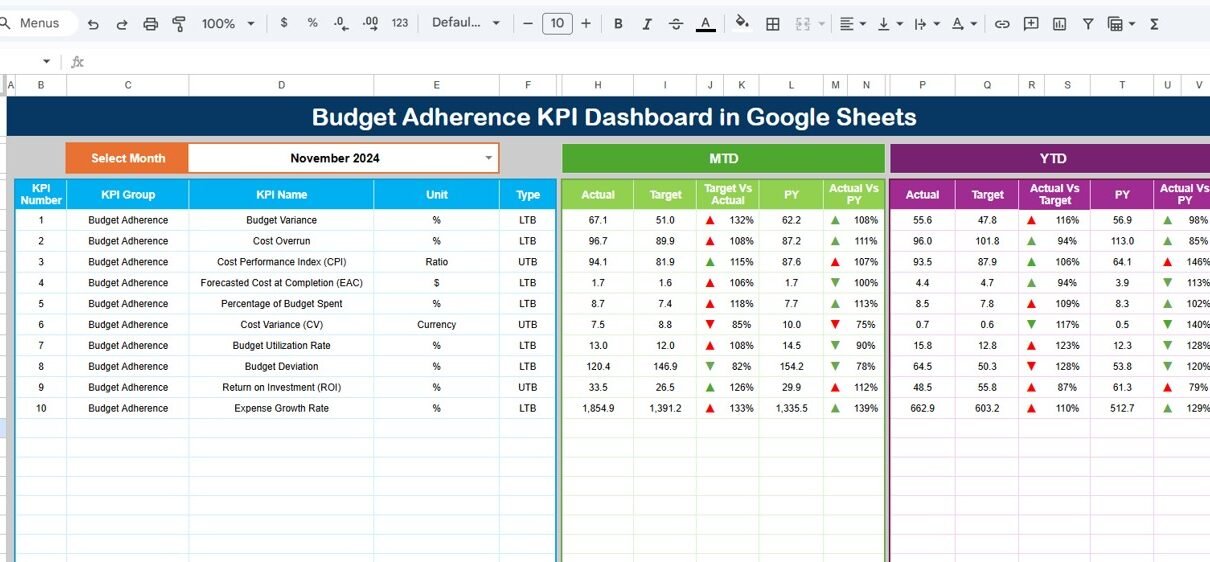
1. Dashboard Sheet Tab (Main Page)
This sheet acts as the control center.
Here, users select the month from the dropdown located in Cell D3. As soon as the month changes, all values refresh automatically.
The dashboard displays:
-
MTD Actual, Target, Previous Year Values
-
YTD Actual, Target, Previous Year Values
-
Target vs Actual Variances
-
PY vs Actual Variances
All variances use conditional formatting arrows to show whether the KPI improved or declined. Green arrows indicate improvement, and red arrows highlight problem areas.
This page helps leaders understand:
-
Where spending stands today
-
Whether budgets stay aligned
-
If costs rise compared to last year
-
Whether departments follow financial plans

Click to Buy Budget Adherence KPI Dashboard in Google Sheets
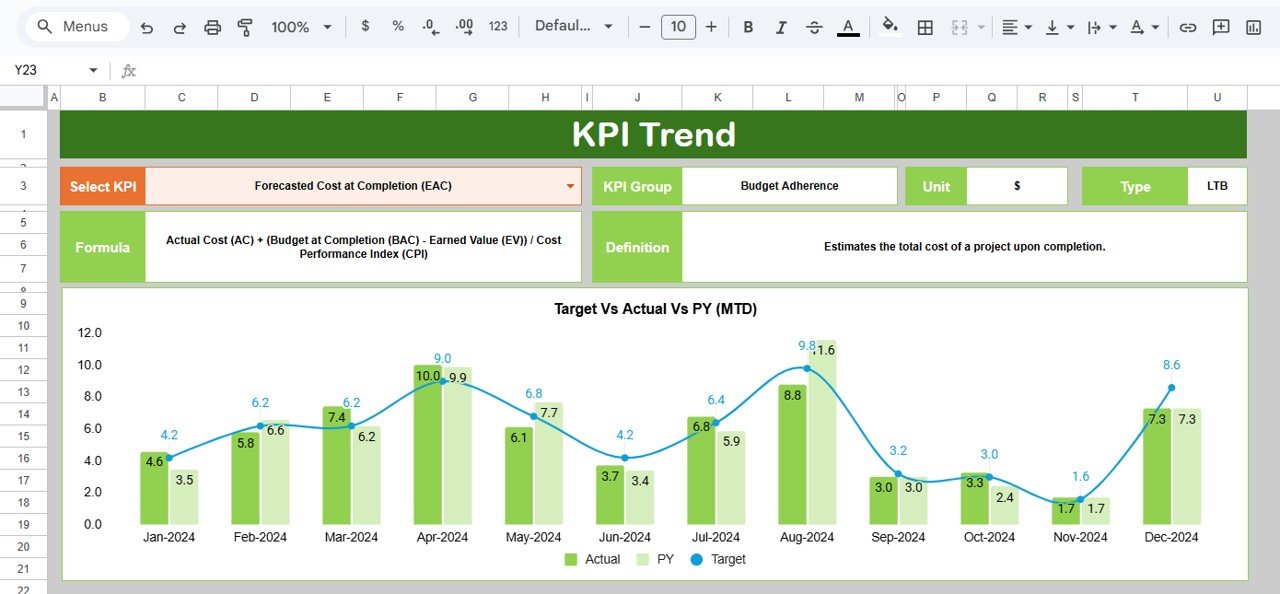
2. KPI Trend Sheet Tab
This worksheet provides a deeper view of each KPI.
Users select a KPI name from the dropdown in Cell C3. The sheet automatically displays:
-
KPI Group
-
Unit
-
KPI Type (Upper the Better or Lower the Better)
-
Formula used for calculation
-
Short definition of the KPI
This makes it easy to understand how each financial metric behaves and what it represents.
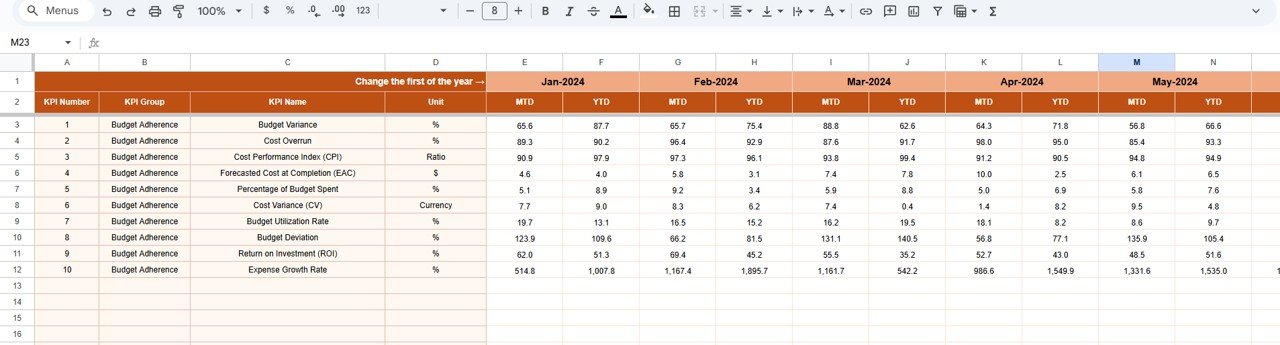
3. Actual Number Sheet Tab
This sheet stores MTD and YTD actual financial numbers for every KPI.
Users select the month using the dropdown in Cell E1.
They also input the first month of the financial year in Cell E1 (for example, Jan or Apr depending on fiscal year).
This structured design ensures accuracy in financial reporting.
Click to Buy Budget Adherence KPI Dashboard in Google Sheets
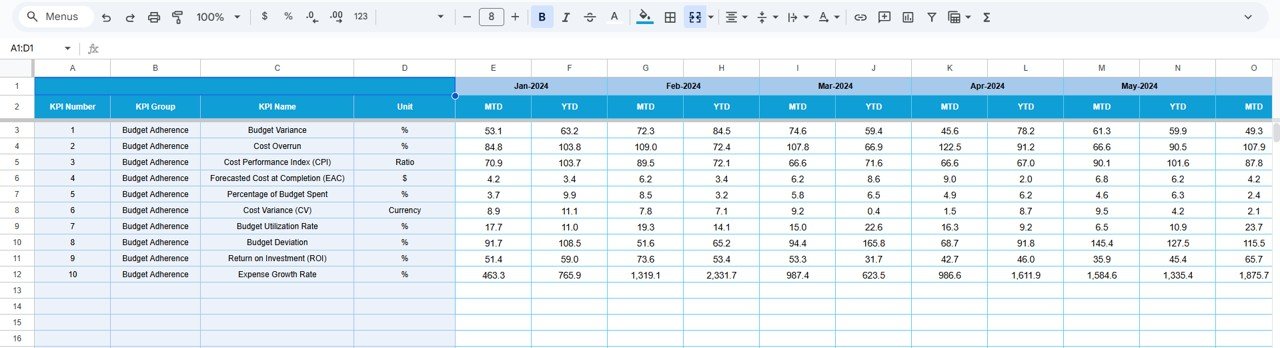
4. Target Sheet Tab
This sheet contains:
-
Monthly MTD Targets
-
Monthly YTD Targets
Users enter target numbers for every KPI and for every month. The dashboard compares these targets against actual performance.
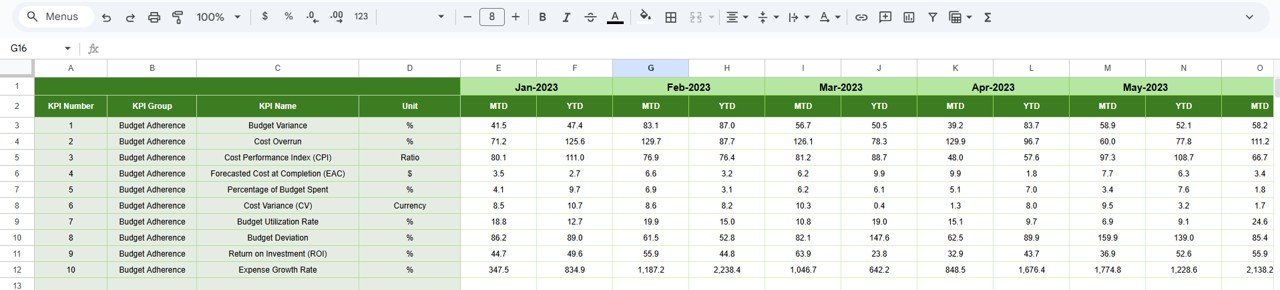
5. Previous Year Number Sheet Tab
Here, users enter last year’s monthly values in the same format as the current year. The dashboard uses these numbers to calculate PY vs Actual comparisons.
This provides clear insights into spending growth or reduction over time.
Click to Buy Budget Adherence KPI Dashboard in Google Sheets
KPI Definition Sheet Tab
This is the master table that defines:
-
KPI Names
-
KPI Groups
-
Units
-
Formulas
-
Definitions
-
KPI Type (LTB / UTB)
Finance managers use this sheet to maintain consistency across all reports.
Below is the complete KPI table for your dashboard.

Advantages of Using a Budget Adherence KPI Dashboard in Google Sheets
Click to Buy Budget Adherence KPI Dashboard in Google Sheets
This dashboard gives organizations a clear financial direction. Here are the major advantages.
- Real-Time Budget Awareness; Teams understand their spending status instantly. No need to calculate, summarize, or merge spreadsheets.
- Improved Financial Discipline: Users track actual vs target spending every month, which reduces overspending and supports responsible financial behavior.
- Faster Decision-Making; Comparisons with previous year data help leaders make quick and accurate decisions.
- Clear Department-Level Visibility: Every department monitors its budget utilization and avoids unnecessary expenses.
- Early Detection of Financial Risks: Dashboard highlights variance trends so users take corrective action early.
- Simple and User-Friendly Interface: Even non-financial users understand KPIs easily because of clean design and dropdown controls.
- Automated Monthly Reporting: You never recreate financial reports again.
Just change the month—everything updates automatically.
Best Practices for Using a Budget Adherence KPI Dashboard
To maximize value, follow these best practices.
- Update Actual Numbers Weekly or Monthly: This keeps the dashboard accurate and meaningful.
- Set Realistic Targets: Financial targets should be achievable and aligned with past performance.
- Compare Variances Consistently; Negative variances reveal problem areas. Frequent checks reduce financial risk.
- Track Forecast Accuracy; High forecast accuracy leads to better planning and fewer financial surprises.
Conclusion
Click to Buy Budget Adherence KPI Dashboard in Google Sheets
A Budget Adherence KPI Dashboard in Google Sheets gives businesses a powerful tool to monitor spending, control budgets, and improve financial stability. Its structured worksheets, clean KPI views, and automatic updates save time and support smarter decisions.
When teams use this dashboard regularly, they avoid overspending, align budgets with business goals, and stay financially healthy throughout the year. This dashboard becomes an essential financial tracking solution for any organization.
Frequently Asked Questions (FAQ)
1. What is a Budget Adherence KPI Dashboard in Google Sheets?
It is a reporting tool that tracks budget vs actual spending using KPIs, charts, and automated calculations.
2. Who should use this dashboard?
Finance teams, department heads, project managers, and business owners.
3. How often should data be updated?
Monthly updates are ideal, but weekly updates provide better control.
4. Can beginners use this dashboard?
Yes. The dropdowns and automatic calculations make it very easy.
5. What KPIs are included?
Budget variance, budget variance %, operating cost, procurement spend, savings achieved, and more.
6. Can I customize the KPIs?
Yes. You can add, edit, or remove KPIs from the KPI Definition Sheet.
7. Why compare actual numbers with previous year?
It helps identify growth, cost spikes, and performance patterns.
Visit our YouTube channel to learn step-by-step video tutorials
Youtube.com/@NeotechNavigators
Watch the step-by-step video tutorial:
Click to Buy Budget Adherence KPI Dashboard in Google Sheets