Managing a call center effectively requires constant monitoring of various performance metrics. These metrics, often referred to as Key Performance Indicators (KPIs), help managers ensure that their team meets operational goals and delivers excellent customer service. Creating a Call Center KPI Dashboard in Google Sheets allows you to track these metrics efficiently and in real-time.
In this comprehensive guide, we’ll walk you through how to create a Call Center KPI Dashboard in Google Sheets. We will also cover the key features of this dashboard, provide a list of important KPIs, and explain their formulas, definitions, and whether they are “Lower the Better” or “Upper the Better.”
Table of Contents
ToggleWhat is a Call Center KPI Dashboard?
A Call Center KPI Dashboard is a visual tool used to monitor and track key metrics that measure the efficiency and effectiveness of call center operations. These metrics can include customer satisfaction, average handling time, first call resolution rate, and more. By tracking these KPIs, managers can easily assess the performance of both individual agents and the entire call center.
Using Google Sheets for your dashboard offers a flexible and accessible solution. You can easily input, update, and visualize data while collaborating with your team in real-time.
Key Features of the Call Center KPI Dashboard in Google Sheets
Click to buy Call Center KPI Dashboard in Google Sheets
The Call Center KPI Dashboard in Google Sheets is designed to provide a clear and concise view of your call center’s performance. Below are the key features:
1. Dashboard Sheet Tab
The Dashboard Sheet serves as the main view of your call center’s KPIs. Here’s what you can expect:
-
Month Selection: You can select the month from a dropdown in cell D3. This automatically updates the dashboard with the selected month’s data.
-
Key Metrics: The dashboard displays MTD (Month-to-Date) Actuals, Targets, and Previous Year Data. It also shows Target vs Actual and Previous Year vs Actual comparisons with conditional formatting, including up and down arrows.
-
YTD (Year-to-Date) Metrics: Similar to the MTD metrics, this section displays YTD Actuals, Targets, and Previous Year Data, along with the corresponding comparisons.

Click to buy Call Center KPI Dashboard in Google Sheets
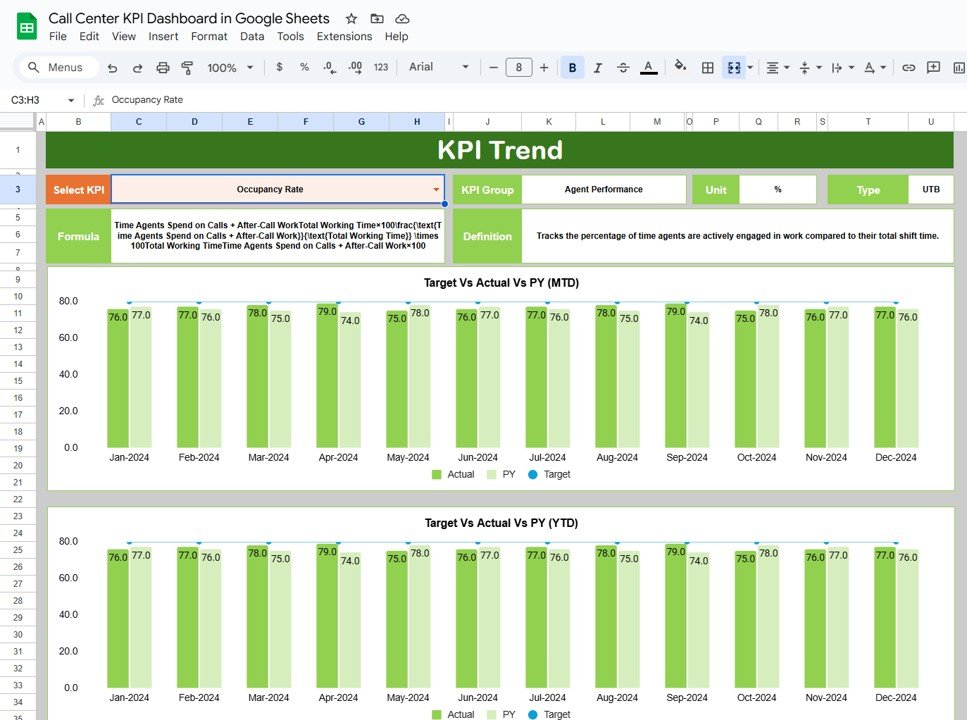
2. KPI Trend Sheet Tab
In the KPI Trend Sheet, you can:
-
Select a specific KPI Name from a dropdown in C3.
-
View the KPI Group, Unit, and Type (whether “Lower the Better” or “Upper the Better”).
-
See the Formula for each KPI and understand its Definition.
Click to buy Call Center KPI Dashboard in Google Sheets
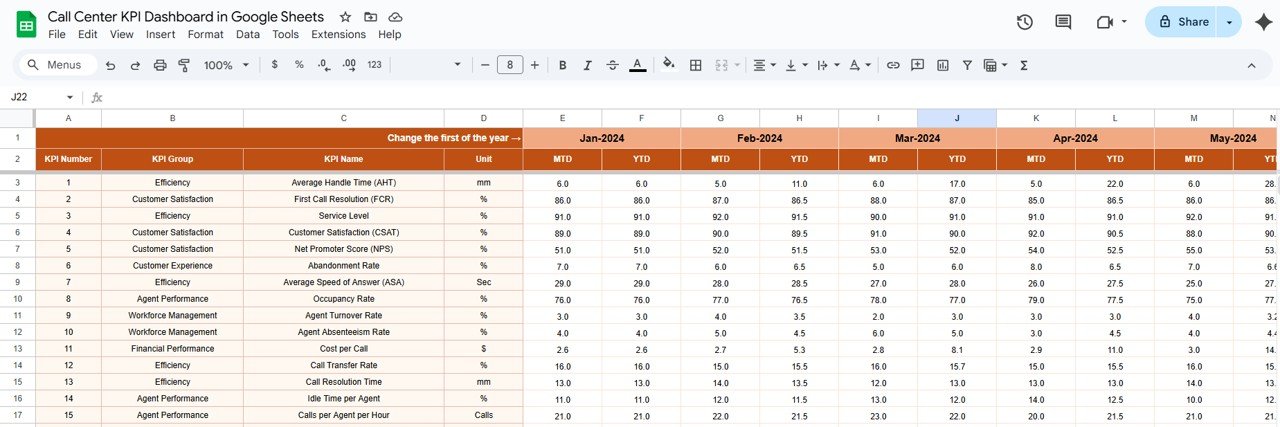
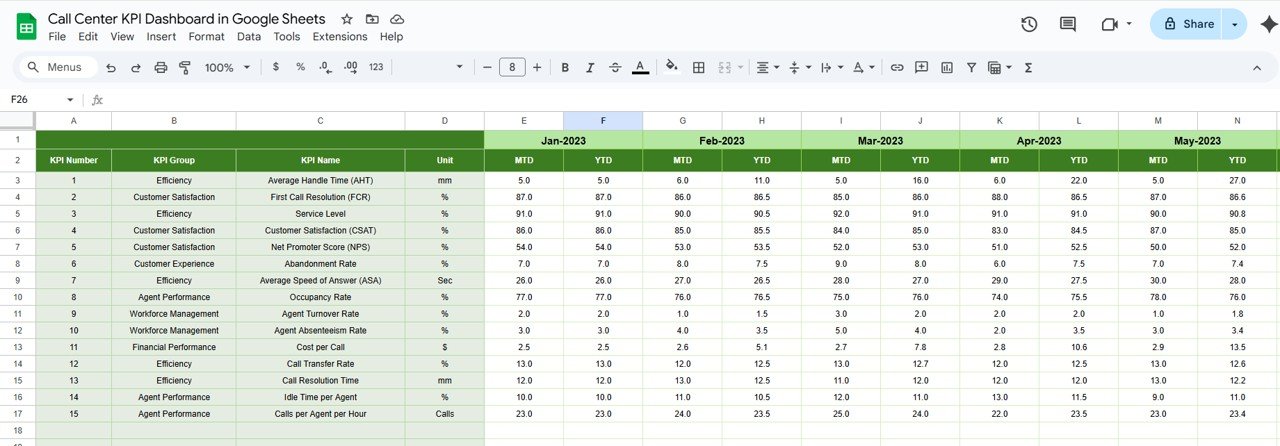
3. Actual Numbers Sheet Tab
This tab is where you input actual data for both MTD and YTD performance. Simply select the first month of the year in E1, and enter the relevant data. This keeps your dashboard updated and accurate.
Click to buy Call Center KPI Dashboard in Google Sheets
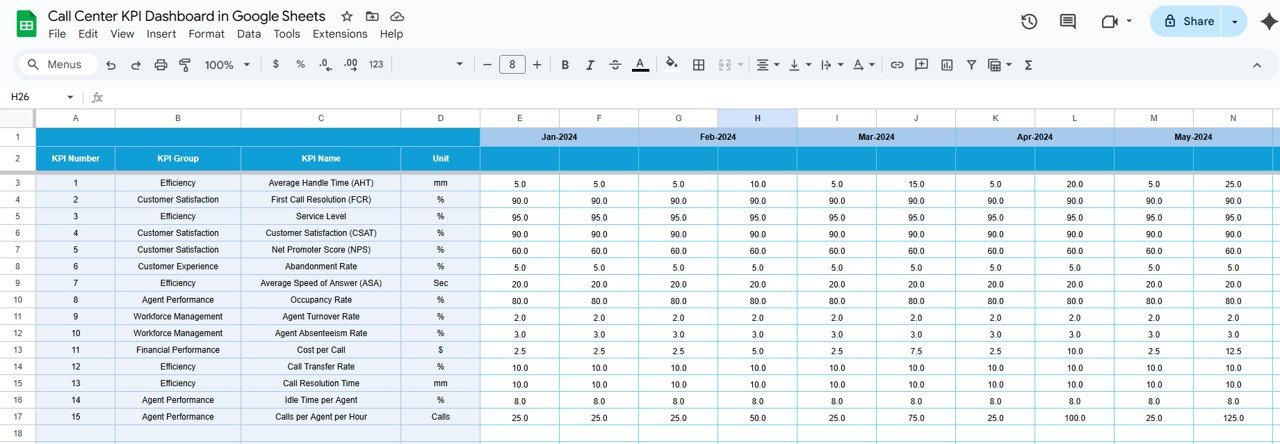
4. Target Sheet Tab
In this sheet, you enter the target values for each KPI for the current month’s MTD and YTD. These values are compared with the actual numbers to calculate performance.
Click to buy Call Center KPI Dashboard in Google Sheets
5. Previous Year Numbers Sheet Tab
Here, you can input the corresponding metrics from the previous year, allowing you to track year-over-year changes and trends.
Click to buy Call Center KPI Dashboard in Google Sheets
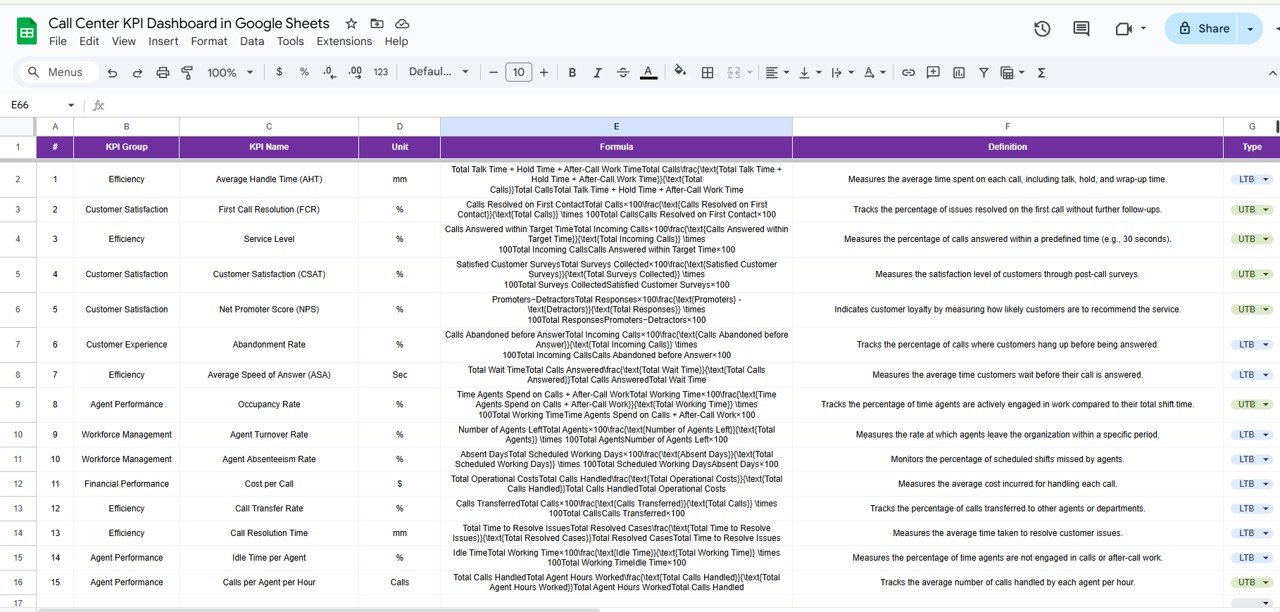
6. KPI Definition Sheet Tab
This sheet contains detailed information about each KPI. You can define the KPI Name, KPI Group, Unit, Formula, and provide a clear Definition for each metric. This ensures that everyone in the call center team understands the KPIs they are tracking.
Click to buy Call Center KPI Dashboard in Google Sheets
Advantages of Using a Call Center KPI Dashboard
A Call Center KPI Dashboard provides several benefits to call center managers and teams:
- Real-Time Monitoring: With a KPI dashboard, managers can monitor call center performance in real-time. This allows for immediate identification of issues and opportunities for improvement.
- Data-Driven Decisions: By using actual performance data, managers can make informed decisions about staffing, training, and process improvements.
- Improved Efficiency: Tracking KPIs such as AHT and FCR helps identify areas where call center processes can be optimized, leading to better efficiency and productivity.
- Enhanced Customer Satisfaction: By monitoring customer satisfaction KPIs like CSAT, call centers can identify trends and take action to improve the customer experience.
- Employee Performance Insights: A KPI dashboard also helps track individual agent performance, enabling managers to offer constructive feedback and tailor training programs.
Opportunities for Improvement in Call Center KPI Dashboards
Click to buy Call Center KPI Dashboard in Google Sheets
While the Call Center KPI Dashboard offers valuable insights, there are always opportunities for improvement:
- Integration with Call Center Software: Integrating the dashboard with your call center software can automate data input, ensuring real-time updates and reducing manual entry errors.
- Enhanced Data Visualization: Incorporating advanced data visualizations like charts, graphs, and heatmaps can make the dashboard more interactive and provide better insights at a glance.
- Mobile Optimization: Optimizing the dashboard for mobile devices allows managers to track call center performance on the go, especially during off-site meetings or travel.
- Employee Feedback Integration: Including employee feedback in the dashboard can provide a more holistic view of call center performance, beyond just customer satisfaction and agent metrics.
Best Practices for Creating a Call Center KPI Dashboard
Click to buy Call Center KPI Dashboard in Google Sheets
To maximize the value of your Call Center KPI Dashboard, follow these best practices:
- Define Clear KPIs: Before creating the dashboard, make sure the KPIs you track align with your call center’s goals. This will ensure that the data you gather is meaningful and actionable.
- Update Data Regularly: For the dashboard to be effective, it’s crucial to update data regularly. This ensures that your decisions are based on the most current information available.
- Focus on Key Metrics: Avoid overloading the dashboard with too many KPIs. Focus on the metrics that matter most to your call center’s success.
- Ensure Data Accuracy: Always verify the data entered into the dashboard. Inaccurate data can lead to poor decision-making and undermine the value of the dashboard.
- Make the Dashboard Interactive: Allow users to filter data, select different time periods, and drill down into specific KPIs for deeper analysis.
Frequently Asked Questions (FAQs)
Click to buy Call Center KPI Dashboard in Google Sheets
What KPIs should I track on a Call Center KPI Dashboard?
The most important KPIs to track include Average Handle Time (AHT), First Call Resolution (FCR), Customer Satisfaction (CSAT), Call Abandonment Rate, Service Level, Agent Utilization Rate, and Agent Turnover Rate.
How can I create a Call Center KPI Dashboard in Google Sheets?
You can create a Call Center KPI Dashboard by setting up sheets for each KPI, entering actual numbers and targets, and using Google Sheets’ features like dropdown menus and conditional formatting to make the dashboard interactive.
Why is monitoring Average Handle Time (AHT) important?
AHT is a key indicator of efficiency in a call center. Lower AHT suggests that agents are resolving issues quickly, which leads to higher productivity and lower customer wait times.
How can I improve Customer Satisfaction (CSAT) in my call center?
Improving CSAT involves training agents to handle calls efficiently, maintaining high service levels, and ensuring that customer concerns are addressed on the first call.
Can I integrate my Call Center KPI Dashboard with other tools?
Yes, you can integrate your KPI dashboard with call center software or CRM tools to automate data collection and ensure real-time updates.
Conclusion
Click to buy Call Center KPI Dashboard in Google Sheets
A Call Center KPI Dashboard is an essential tool for tracking the performance of your call center. It provides valuable insights that can help improve efficiency, enhance customer satisfaction, and optimize agent performance. By following best practices and continuously improving the dashboard, you can ensure that your call center operates at its highest potential.
Visit our YouTube channel to learn step-by-step video tutorials
Youtube.com/@NeotechNavigators
Click to buy Call Center KPI Dashboard in Google Sheets
Watch the step-by-step video Demo: