Cash flow drives every business. When your cash inflow stays smooth and predictable, you can plan growth, invest confidently, and avoid financial stress. However, many organizations still track cash flow manually in scattered spreadsheets. As a result, they miss early warning signs and cannot measure performance accurately.
A Cash Flow KPI Dashboard in Google Sheets solves this problem with a simple, powerful, and real-time reporting system. It helps finance teams track daily, monthly, and yearly cash performance with interactive charts, KPI cards, comparisons, and structured inputs.
What Is a Cash Flow KPI Dashboard in Google Sheets?
A Cash Flow KPI Dashboard in Google Sheets is a smart financial reporting tool that tracks, analyzes, and visualizes all cash inflows and outflows in one place. It turns raw finance numbers into meaningful insights, such as liquidity trends, cash burn rate, working capital performance, payment behavior, and revenue-to-cash conversions.
The dashboard refreshes instantly when you update the actual, target, or previous year numbers. You only select the month and watch all charts and KPIs update in real time.
Since it runs in Google Sheets, the dashboard supports:
-
Cloud access
-
Real-time collaboration
-
No software installation
-
Simple customization
-
Instant sharing with teams
This makes it a perfect solution for startups, SMEs, finance teams, consultants, and CFOs.
Key Features of the Cash Flow KPI Dashboard in Google Sheets
Click to Buy Cash Flow KPI Dashboard in Google Sheets
This dashboard includes 6 powerful worksheets, each designed to simplify reporting and improve decisions.
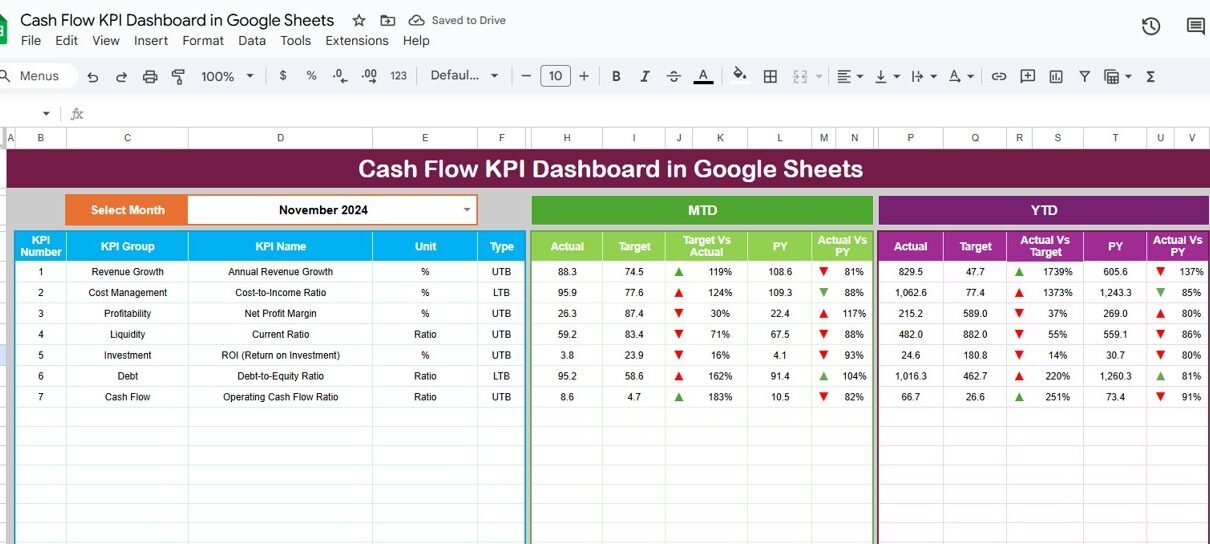
1. Dashboard Sheet Tab (Main Dashboard)
The Dashboard Sheet Tab is the heart of the system. This is where all KPIs appear in a clean and visually rich layout.
-
You select the month from the dropdown at Range D3
-
All MTD (Month-to-Date) and YTD (Year-to-Date) numbers update instantly
-
Conditional formatting highlights performance with green up arrows and red down arrows
Each KPI displays:
-
Actual (MTD/YTD)
-
Target
-
Previous Year
-
Target vs Actual comparison
-
PY vs Actual comparison
This helps you understand the health of your cash flow at a glance.

Click to Buy Cash Flow KPI Dashboard in Google Sheets
2. KPI Trend Sheet Tab
The KPI Trend Sheet Tab allows deep-dive analysis.
-
You select the KPI name from the dropdown at Range C3
-
The dashboard displays the KPI Group, Unit, Type (UTB or LTB), Formula, and Definition
-
Trend charts show the movement of that KPI over months
This sheet helps analyze financial patterns and identify improvement areas.

3. Actual Number Sheet Tab
This sheet stores all actual MTD and YTD cash numbers.
-
You change the current month using Range E1
-
You update the values for each KPI for the selected month
-
The dashboard pulls these numbers automatically
This ensures accuracy and transparency.

Click to Buy Cash Flow KPI Dashboard in Google Sheets
4. Target Sheet Tab
This sheet collects the target values for each KPI.
-
Enter both MTD Target and YTD Target
-
Targets help compare performance and measure progress
It supports strategic planning and realistic forecasting.

5. Previous Year Number Sheet Tab
Here you enter the previous year’s MTD and YTD numbers.
The dashboard uses these numbers for:
-
Year-on-year comparisons
-
PY vs Actual performance
-
Seasonal pattern tracking
This makes historical trend analysis simple and accurate.

Click to Buy Cash Flow KPI Dashboard in Google Sheets
6. KPI Definition Sheet Tab
This sheet defines every KPI with:
- KPI Name
- KPI Group
- Unit
- Formula
- KPI Definition
- KPI Type (LTB or UTB)
It helps maintain consistency and creates a strong reference for finance teams.

Why Do Companies Need a Cash Flow KPI Dashboard?
Businesses depend on strong cash flow, not profit alone. A dashboard helps teams:
-
Understand liquidity instantly
-
Plan payments with confidence
-
Predict future cash shortages
-
Improve working capital
-
Speed up collections
-
Control expenses early
Since Google Sheets is cloud-based, updates happen in real time. Teams always work on the same version, which removes confusion and improves collaboration.
Advantages of a Cash Flow KPI Dashboard in Google Sheets
Click to Buy Cash Flow KPI Dashboard in Google Sheets
1. Clear Visibility
You see inflows, outflows, and monthly movements in one place.
2. Better Financial Decisions
You act early because you understand trends faster.
3. Improved Cash Planning
Targets and comparisons reveal performance gaps.
4. Simple Collaboration
Google Sheets lets your finance team work together from any device.
5. Easy Automation
Formulas, dropdowns, and charts update dashboards instantly.
Best Practices for Using the Cash Flow KPI Dashboard
1. Update Actual Numbers Regularly
Daily or weekly updates keep insights accurate.
2. Set Realistic Targets
Targets help teams improve performance step by step.
3. Track Trends, Not Just Monthly Numbers
Trend analysis helps spot early warning signs.
4. Refresh Previous Year Data Once Per Year
This strengthens year-over-year comparison.
5. Keep KPI Definitions Clear
A consistent definition avoids confusion across teams.
Concluson
Click to Buy Cash Flow KPI Dashboard in Google Sheets
A Cash Flow KPI Dashboard in Google Sheets gives businesses a simple yet powerful way to track financial performance. It brings transparency, improves forecasting, and helps your team control cash flow with confidence. Because the dashboard runs on Google Sheets, you enjoy flexibility, real-time insights, and easy access from anywhere.
Use this dashboard to understand cash availability, optimize working capital, and guide your company toward stable financial growth.
Frequently Asked Questions (FAQs)
1. Who should use a Cash Flow KPI Dashboard?
Finance teams, CFOs, startup founders, accountants, and consultants benefit the most.
2. Can I customize the KPIs?
Yes. You can add, edit, or remove KPIs based on your business model.
3. How often should I update the numbers?
Weekly updates help, but daily updates give accurate real-time insights.
4. Do I need advanced Excel skills?
No. The dashboard uses simple formulas and dropdowns.
5. Can I track YoY trends?
Yes. The dashboard compares Actual, Target, and Previous Year values automatically.
Visit our YouTube channel to learn step-by-step video tutorials
Youtube.com/@NeotechNavigators
Watch the step-by-step video tutorial: