Charity fundraising is crucial for nonprofits, ensuring they meet their financial goals and sustain their missions. A Charity Fundraising KPI Dashboard in Google Sheets can play a pivotal role in tracking and measuring the success of fundraising efforts. By displaying key performance indicators (KPIs) in one place, it provides valuable insights, helps improve decision-making, and ensures that fundraising activities stay on target. In this article, we’ll dive into how you can create and use an effective Charity Fundraising KPI Dashboard in Google Sheets to track the performance of your fundraising efforts.
What is a Charity Fundraising KPI Dashboard?
A Charity Fundraising KPI Dashboard is a tool that allows nonprofit organizations to monitor and visualize the effectiveness of their fundraising efforts. The dashboard uses KPIs to track various metrics such as donations raised, donor engagement, event performance, and campaign success.
In Google Sheets, this dashboard can be a dynamic and interactive tool that updates automatically with data entries. By aggregating critical information, such as Month-to-Date (MTD) and Year-to-Date (YTD) performance, it helps organizations stay on top of their goals and performance trends.
Key Features of the Charity Fundraising KPI Dashboard
The Charity Fundraising KPI Dashboard in Google Sheets is structured to give you real-time insights into your fundraising performance. Here’s an overview of its key features:
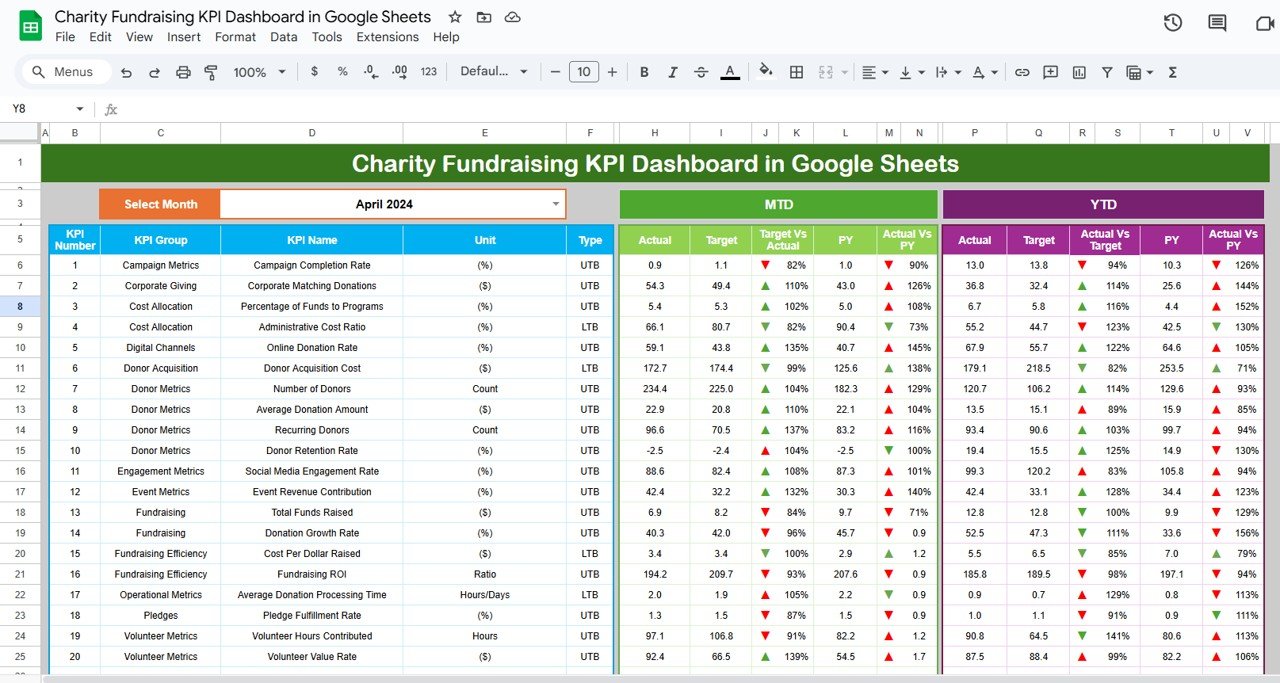
1. Dashboard Sheet Tab
This is the main page of the dashboard where all essential KPIs are displayed. Here, you can select the month from a drop-down menu located in Range D3, and the dashboard will automatically update to reflect the MTD (Month-to-Date) and YTD (Year-to-Date) data.
The dashboard presents:
-
MTD Actual, Target, Previous Year data, along with Target vs Actual and PY (Previous Year) vs Actual, all with conditional formatting (e.g., up or down arrows).
-
YTD Actual, Target, Previous Year data, similarly displayed with Target vs Actual and PY vs Actual.
This allows you to visualize performance trends and adjust fundraising strategies in real-time.

Click to buy Charity Fundraising KPI Dashboard in Google Sheets
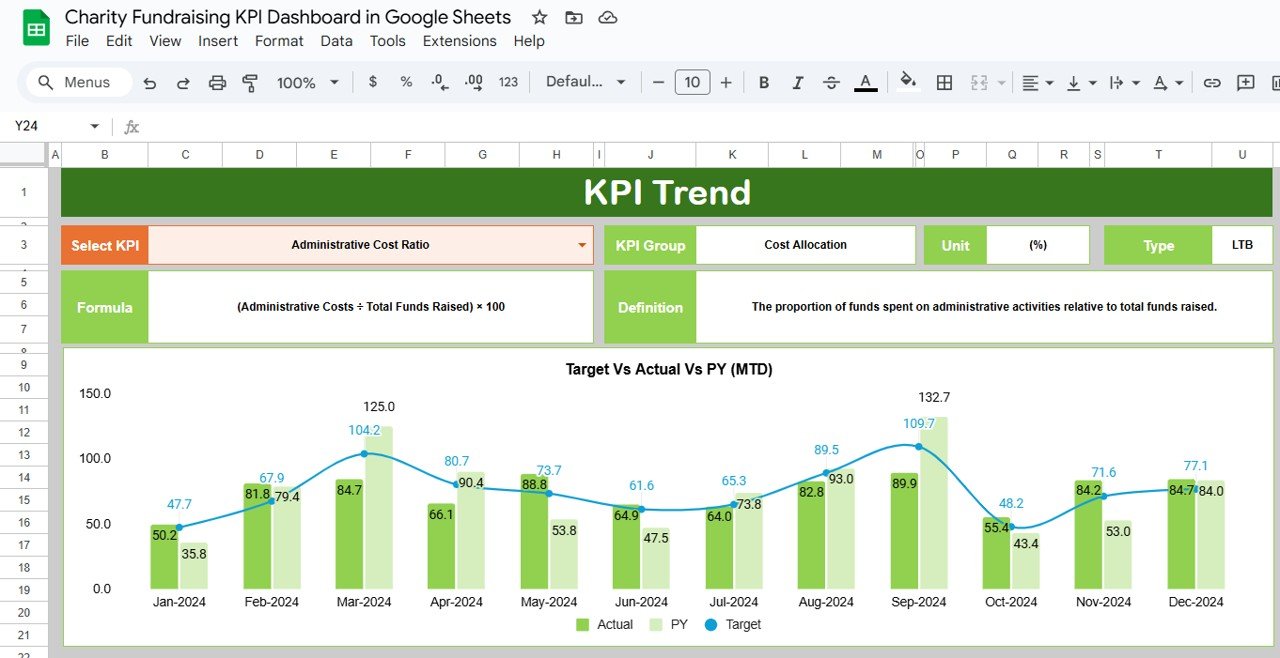
2. KPI Trend Sheet Tab
The KPI Trend Sheet enables users to select any KPI from the drop-down menu in Range C3. For the selected KPI, the following information is displayed:
-
KPI Group
-
Unit of KPI
-
Type of KPI (Lower the better or Upper the better)
-
Formula for the KPI
-
Definition of the KPI
This sheet helps you understand the underlying data for each KPI, how it’s calculated, and whether higher or lower values are favorable.
Click to buy Charity Fundraising KPI Dashboard in Google Sheets
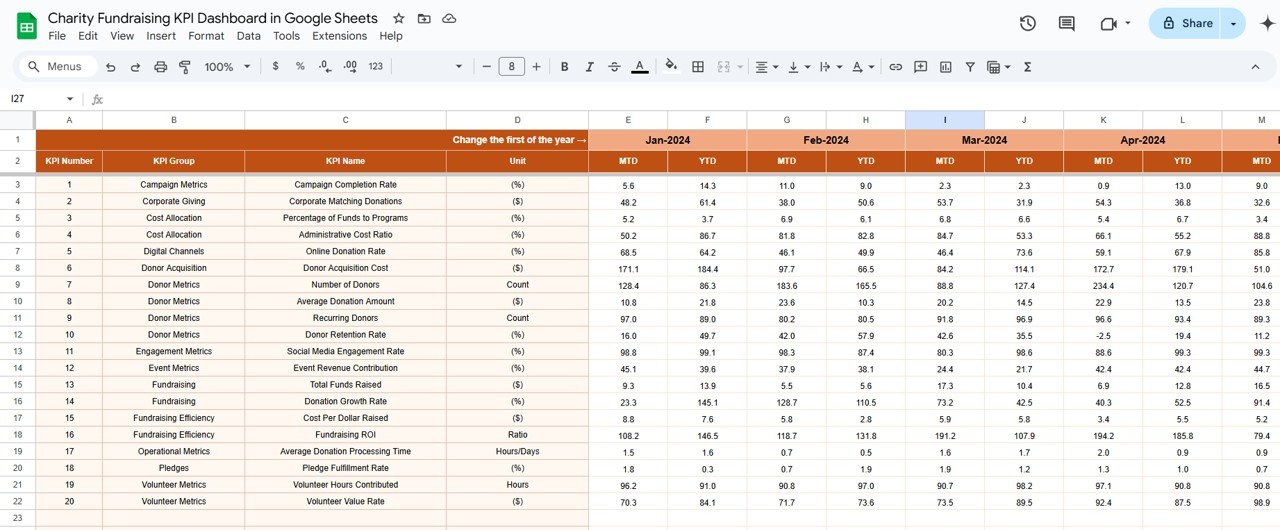
3. Actual Numbers Sheet Tab
In the Actual Numbers Sheet, you will input the actual values for each KPI, both for MTD and YTD. By selecting the month from Range E1, the sheet allows you to track progress for that specific month while comparing it with targets and previous year data.
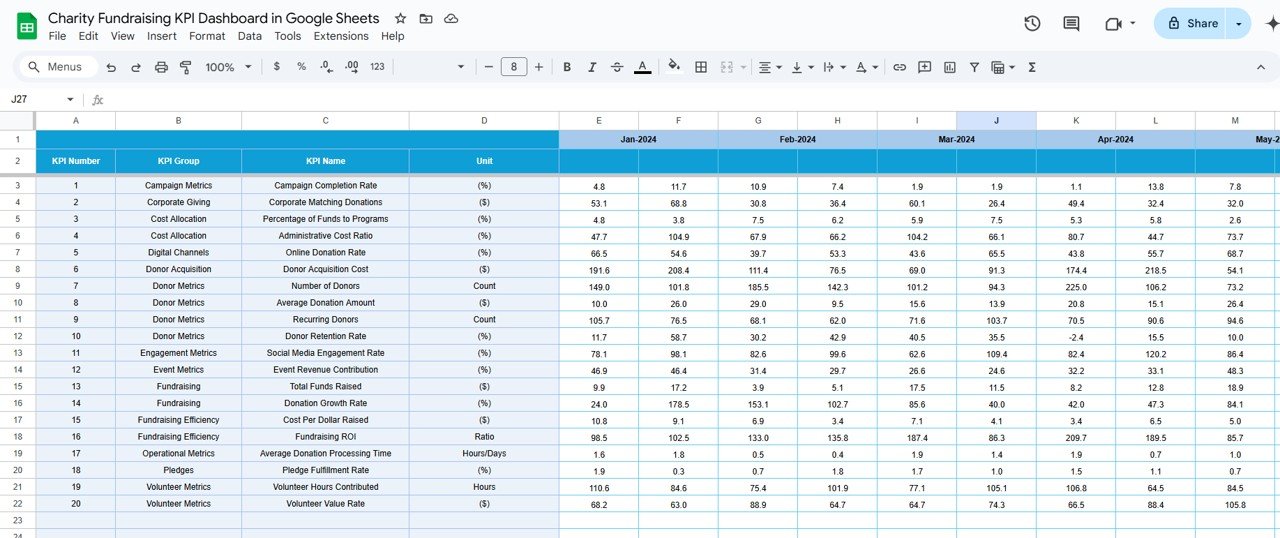
4. Target Sheet Tab
In this sheet, you’ll enter the target values for each KPI. You can track targets for both MTD and YTD for a specific month. The Target Sheet helps you establish measurable goals and compare actual performance with planned objectives.
Click to buy Charity Fundraising KPI Dashboard in Google Sheets
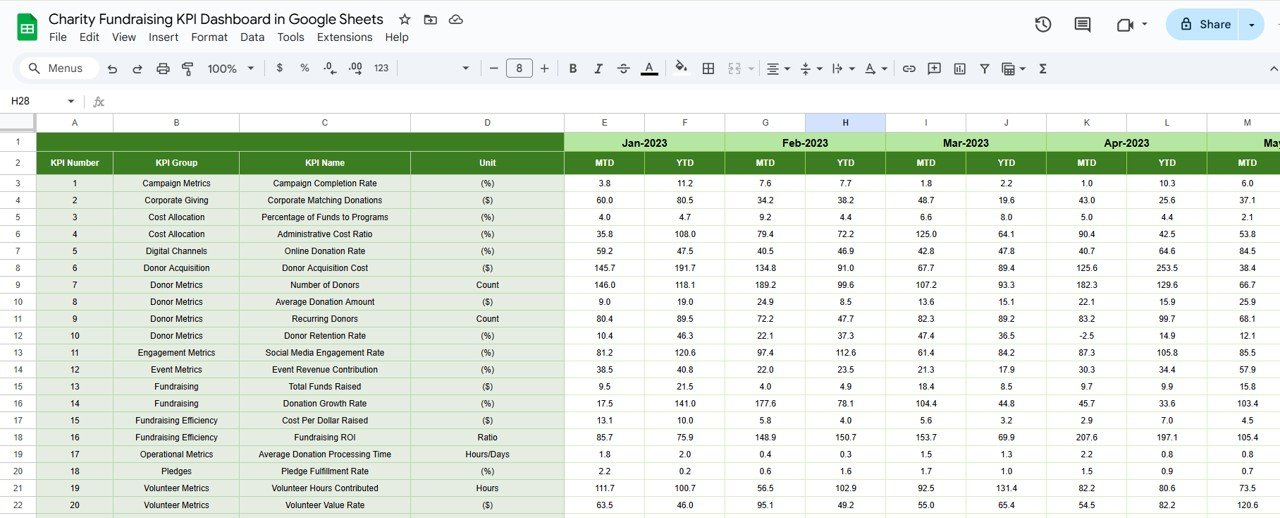
5. Previous Year Numbers Sheet Tab
This sheet is dedicated to entering the previous year’s data for comparison purposes. You will enter the previous year’s actual values for each KPI, which will allow you to perform a Year-over-Year (YoY) comparison, assessing how fundraising efforts have progressed or regressed.
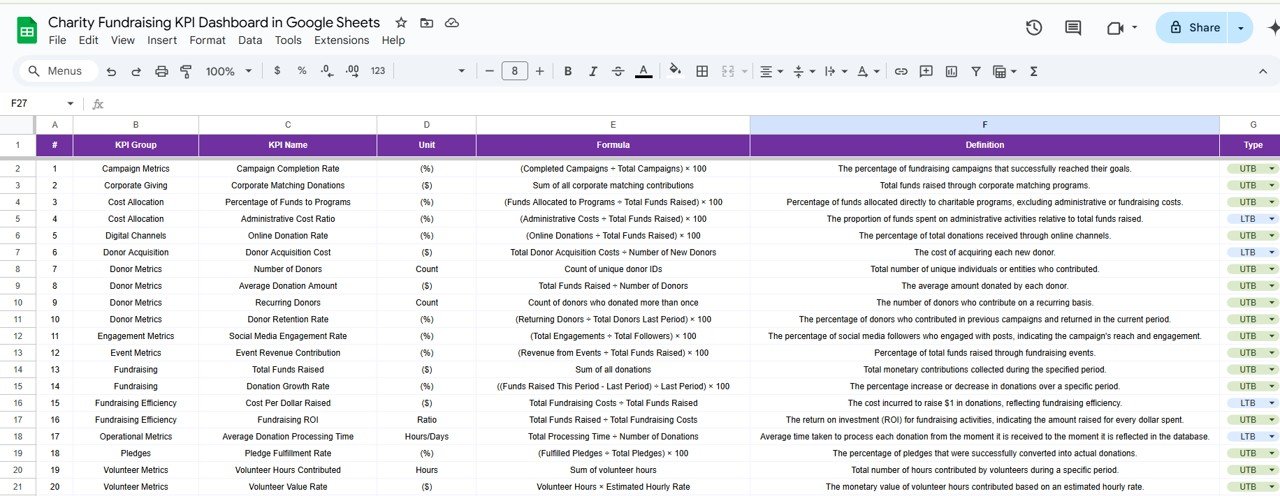
6. KPI Definition Sheet Tab
The KPI Definition Sheet is where the actual definitions and formulas of KPIs are recorded. This ensures consistency and transparency when using the dashboard. It includes:
-
KPI Name
-
KPI Group
-
Unit
-
Formula
-
Definition
This sheet is crucial for maintaining clarity in reporting and ensuring that everyone understands how each KPI is calculated.
Click to buy Charity Fundraising KPI Dashboard in Google Sheets
Advantages of Using a Charity Fundraising KPI Dashboard
- Real-Time Performance Tracking: With the Charity Fundraising KPI Dashboard, you can track the performance of your fundraising activities in real time. By displaying data like MTD and YTD performance, you can see how well you’re progressing towards your fundraising goals and quickly identify areas that need improvement.
- Data-Driven Decision Making: By tracking and visualizing KPIs, the dashboard helps your nonprofit make data-driven decisions. Whether it’s adjusting fundraising strategies or reallocating resources, having real-time data ensures that decisions are based on actual performance rather than assumptions.
- Transparency and Accountability: The dashboard provides a clear and transparent way to showcase the performance of your fundraising efforts. By including data from previous years, as well as actual vs. target comparisons, you provide stakeholders with an easy-to-understand, up-to-date view of fundraising success.
Opportunities for Improvement in Charity Fundraising Efforts
Even the most successful charity fundraising campaigns can always find ways to improve. Here are some opportunities to enhance your fundraising efforts:
- Increase Donor Engagement: Engagement with donors is key to retention. Using the dashboard’s Donor Retention Rate and Campaign Conversion Rate KPIs, you can assess which campaigns engage donors most effectively and focus on strengthening relationships with repeat donors.
- Improve Event Attendance: If the Event Attendance KPI shows lower-than-expected turnout, it may indicate a need for better event promotion or a shift in event formats. Utilize this data to plan events that appeal to your donor base.
- Optimize Fundraising Costs: The Fundraising ROI KPI will help you assess the efficiency of your fundraising campaigns. If ROI is low, consider optimizing your campaign strategies, such as reducing event costs or finding more cost-effective fundraising methods.
Best Practices for Charity Fundraising KPI Dashboard
Click to buy Charity Fundraising KPI Dashboard in Google Sheets
To maximize the effectiveness of your Charity Fundraising KPI Dashboard, follow these best practices:
- Regularly Update Your Data: Ensure your data is current by updating it regularly, ideally monthly. This ensures that you’re making decisions based on the most recent performance metrics.
- Set Clear Targets: Set clear and achievable targets for each KPI. This will help you focus on specific areas for improvement and assess performance against set goals.
- Focus on Key KPIs: While it’s tempting to track many metrics, focusing on the key KPIs that align most closely with your charity’s goals will provide the most actionable insights.
- Leverage Conditional Formatting; Use conditional formatting to highlight key trends, such as over- or under-performance compared to targets, making it easier to spot issues at a glance.
Frequently Asked Questions
What are KPIs, and why are they important for charity fundraising?
KPIs (Key Performance Indicators) are measurable values that track the performance of specific fundraising activities. They help nonprofit organizations assess their success, identify trends, and make data-driven decisions.
How can I use a KPI Dashboard to improve my charity’s fundraising strategy?
A KPI dashboard provides visibility into key fundraising metrics, allowing you to see what’s working and where improvements are needed. By tracking real-time data, you can adjust strategies for better results.
Can I customize the KPI Dashboard to fit my charity’s unique needs?
Yes, the Charity Fundraising KPI Dashboard in Google Sheets is fully customizable. You can modify it to track the KPIs that are most relevant to your charity’s specific fundraising activities.
Conclusion
Click to buy Charity Fundraising KPI Dashboard in Google Sheets
The Charity Fundraising KPI Dashboard in Google Sheets is an invaluable tool for nonprofits, offering real-time insights and facilitating data-driven decision-making. By tracking KPIs such as Total Donations, Donor Retention Rate, and Fundraising ROI, charities can stay on top of their fundraising performance, identify areas for improvement, and ultimately achieve their fundraising goals.
Visit our YouTube channel to learn step-by-step video tutorials
Youtube.com/@NeotechNavigators
Watch the step-by-step video Demo:
Click to buy Charity Fundraising KPI Dashboard in Google Sheets