Managing client billing, invoices, and payments is a critical task for finance teams. The Client Billing Dashboard in Google Sheets is a ready-to-use solution that helps organizations monitor invoice status, track payments, and analyze billing performance. This dashboard consolidates key billing metrics in a single, interactive view, making it easier to manage accounts and optimize cash flow.Client Billing Dashboard in Google Sheets
In this article, we will explain the features, advantages, and best practices of using this dashboard.Client Billing Dashboard in Google Sheets
What Is a Client Billing Dashboard?
A Client Billing Dashboard is a digital tool that consolidates financial metrics related to client invoices and payments. Using Google Sheets, this dashboard allows finance teams to:
-
Monitor total invoices and payments
-
Track overdue or pending invoices
-
Measure payment delays by client or region
-
Analyze billing performance over time
With real-time updates and visualizations, the dashboard provides actionable insights to improve collection efficiency and financial management.
Key Features of the Client Billing Dashboard
Click to Buy Client Billing Dashboard in Google Sheets
This dashboard consists of three main sheets, designed for easy monitoring and analysis:
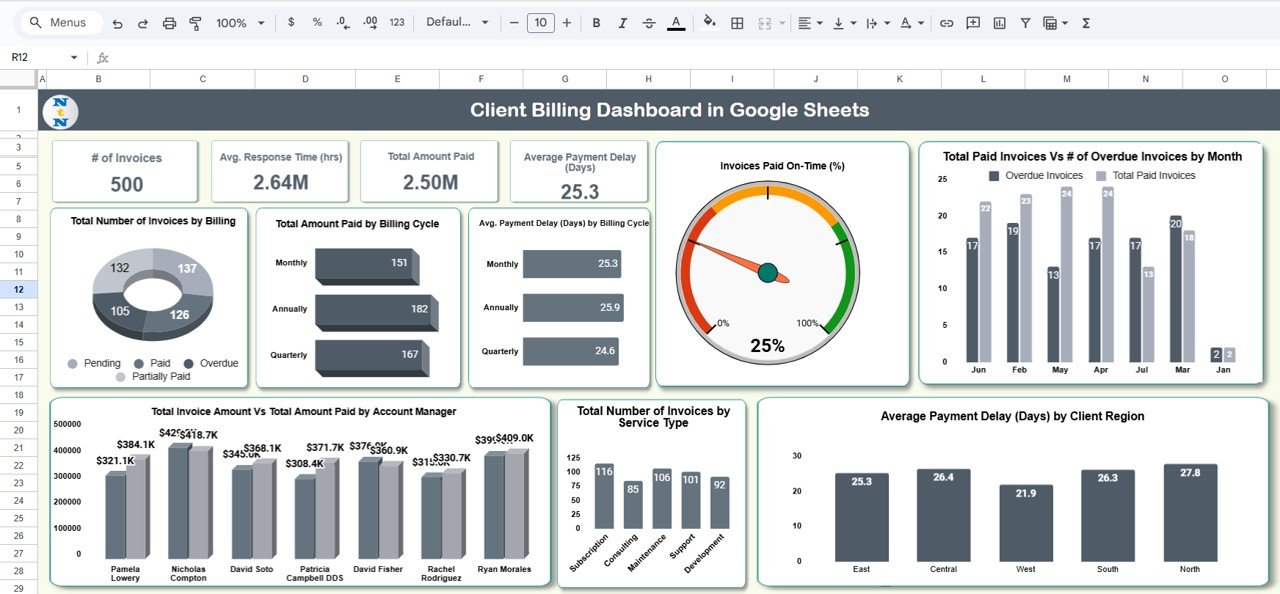
1. Dashboard Sheet Tab
The Dashboard Sheet provides an overview of key billing metrics using cards and charts:
Cards:
-
# of Invoices: Total invoices issued
-
Total Invoice Amount: Sum of all invoice amounts
-
Total Amount Paid: Total payments received from clients
-
Average Payment Delay (Days): Average delay in client payments
Charts:
-
Total Number of Invoices by Billing Status: Tracks invoices that are Paid, Pending, or Overdue
-
Total Amount Paid by Billing Cycle: Visualizes payments across monthly or quarterly cycles
-
Average Payment Delay (Days) by Billing Cycle: Highlights trends in delayed payments
-
Invoices Paid On-Time (%): Shows the percentage of invoices paid within the expected timeline
-
Total Paid Invoices vs. # of Overdue Invoices by Month: Tracks monthly payment efficiency
-
Average Payment Delay (Days) by Client Region: Identifies regional payment trends
-
Total Invoice Amount vs. Total Amount Paid by Account Manager: Compares collected versus billed amounts per account manager
Click to Buy Client Billing Dashboard in Google Sheets
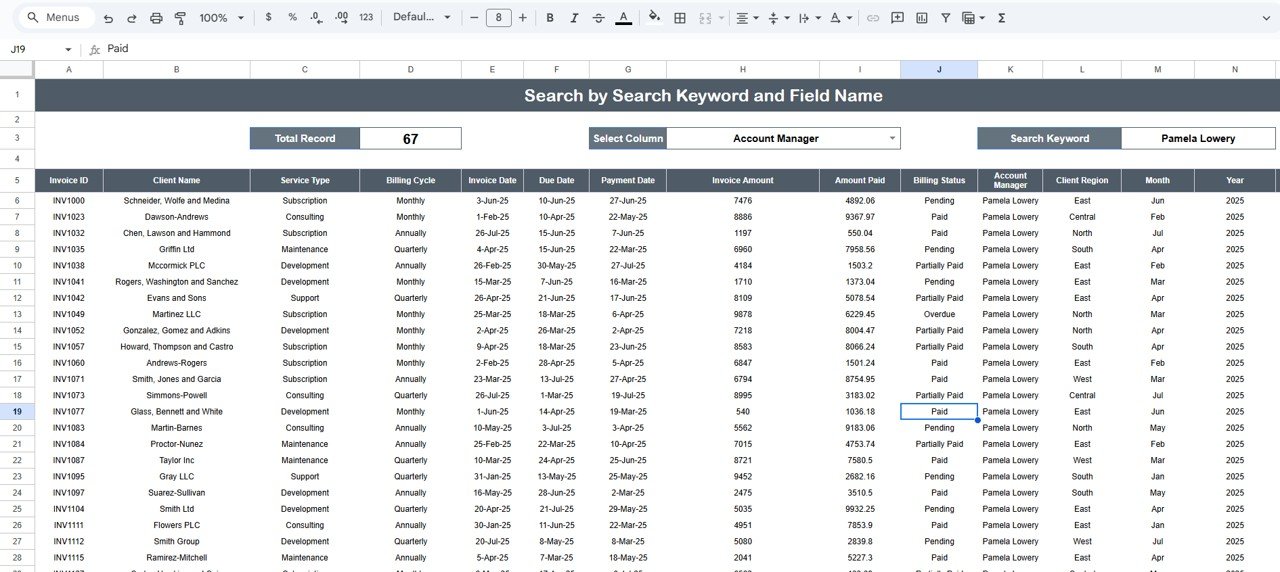
2. Search Sheet
The Search Sheet allows users to quickly find specific invoice or payment records:
-
Search by Keyword and Field Name
-
Filter results by client, account manager, billing cycle, or status
This feature improves accessibility and efficiency for finance teams managing large datasets.
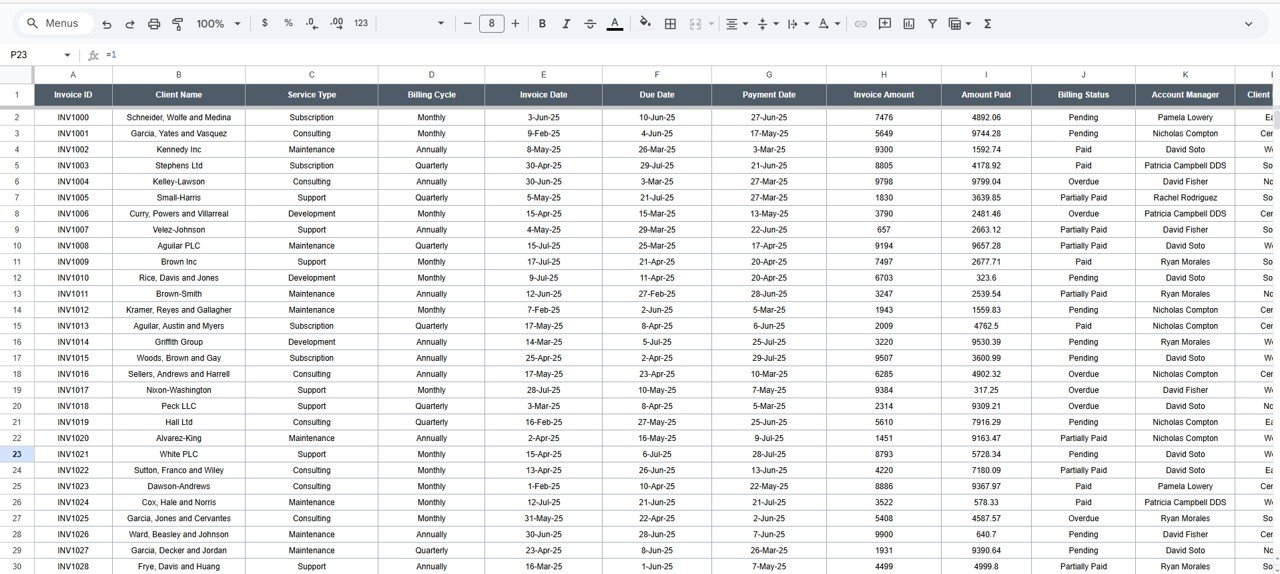
3. Data Sheet Tab
The Data Sheet is the primary input sheet where all billing and payment information is recorded:
-
Invoice number, client details, billing cycle, amount, and status
-
Payment date, amount paid, and payment delay
-
Account manager and client region
Updating this sheet automatically refreshes the Dashboard and Search sheets, ensuring real-time reporting.
Click to Buy Client Billing Dashboard in Google Sheets
Advantages of Using the Client Billing Dashboard
-
Centralized Billing Information: All invoices, payments, and delays are tracked in one location
-
Real-Time Insights: Updates instantly when new data is entered
-
Visual Analysis: Cards and charts highlight overdue payments, on-time payments, and regional trends
-
Improved Collections: Identify delays early and take corrective action
-
Accountability: Compare performance across account managers and regions
-
Customizable: Adjust metrics, charts, or fields to suit your organization’s billing processes
Best Practices for Using the Dashboard
Click to Buy Client Billing Dashboard in Google Sheets
-
Update Data Promptly: Ensure invoice and payment data is entered as soon as it’s available
-
Monitor Delays: Focus on clients or regions with higher average payment delays
-
Track On-Time Payments: Analyze patterns to incentivize timely payments
-
Segment Data by Account Manager: Compare performance across your team
-
Review Monthly Trends: Use charts to identify seasonal trends or billing issues
-
Use Conditional Formatting: Highlight overdue invoices for faster action
How This Dashboard Helps Finance Teams
-
Optimize Cash Flow: Monitor payments and overdue invoices to maintain liquidity
-
Improve Accountability: Track account manager performance and client payment behavior
-
Identify Problem Areas: Spot delays by region, billing cycle, or client
-
Support Decision-Making: Use real-time insights to prioritize follow-ups and reminders
-
Streamline Reporting: Generate visual reports for management or board meetings
Frequently Asked Questions (FAQs)
Click to Buy Client Billing Dashboard in Google Sheets
Q1: Can I customize the dashboard for different billing cycles?
Yes, you can adjust billing cycles, chart ranges, and filters to suit your organization’s needs.
Q2: Can multiple users update this dashboard simultaneously?
Yes, Google Sheets allows real-time collaboration for multiple finance team members.
Q3: How does the dashboard calculate average payment delay?
It calculates the number of days between the invoice due date and the actual payment date for all invoices.
Q4: Can I track invoices by client region or account manager?
Yes, charts and filters allow you to segment data by region, client, or account manager.
Q5: Is this dashboard suitable for large datasets?
Absolutely. Google Sheets handles large volumes, and the dashboard can manage thousands of invoice records efficiently.
Conclusion
Click to Buy Client Billing Dashboard in Google Sheets
The Client Billing Dashboard in Google Sheets is a powerful tool to manage invoices, track payments, and improve collection efficiency. With interactive charts, cards, and a searchable data sheet, finance teams can gain real-time insights, identify delays, and ensure timely revenue collection.
Visit our YouTube channel to learn step-by-step video tutorials
Youtube.com/@NeotechNavigators
Watch the step-by-step video Demo: