Addressing climate change is one of the most significant challenges of our time. To effectively monitor progress and drive impactful action, organizations need to measure and track various climate-related indicators. A Climate Action KPI (Key Performance Indicator) Dashboard in Google Sheets provides a powerful tool for organizations committed to monitoring their climate action goals.
This article will walk you through the features and components of the Climate Action KPI Dashboard in Google Sheets, including a detailed breakdown of key performance indicators (KPIs), their units, formulas, definitions, and the type of KPI (whether “Lower the Better” or “Upper the Better”).
Key Features of the Climate Action KPI Dashboard in Google Sheets
The Climate Action KPI Dashboard in Google Sheets is designed to help organizations track their climate action efforts, measure performance against targets, and identify areas for improvement. The dashboard comes with several essential worksheets, making it easy to input and monitor climate data.
1. Dashboard Sheet Tab
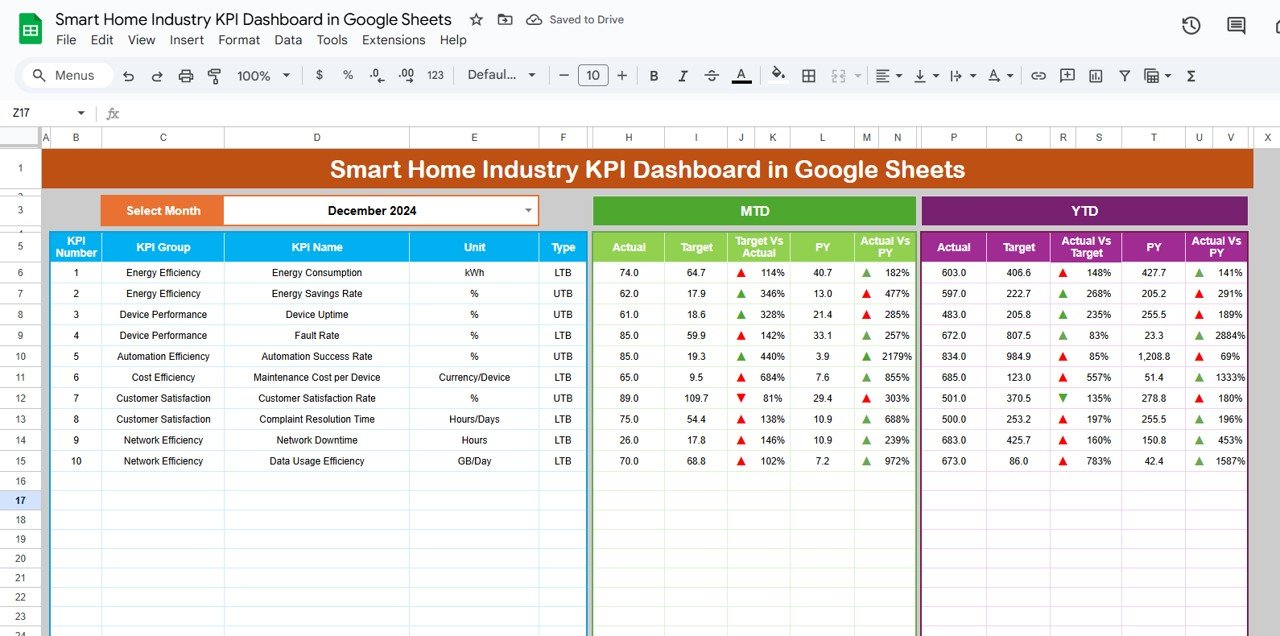
The Dashboard Sheet is the main interface of the Climate Action KPI Dashboard. It provides a comprehensive view of all the KPIs, enabling users to quickly assess performance.
-
Monthly and Yearly Comparison: Users can select the month from the drop-down (range D3), which updates the dashboard with the latest MTD (Month-to-Date) and YTD (Year-to-Date) data.
-
Target vs Actual: The sheet shows actual vs target values for both MTD and YTD, along with previous year data, using conditional formatting (up and down arrows) to highlight any performance gaps.
-
Data Visualization: The dashboard includes color-coded arrows and charts for easy data interpretation.

Click to buy Climate Action KPI Dashboard in Google Sheets
2. KPI Trend Sheet Tab
In the KPI Trend Sheet, you can track each KPI’s performance over time. Here’s what you’ll find:
-
KPI Selection: A drop-down menu (range C3) allows users to select individual KPIs.
-
Detailed KPI Information: Each selected KPI is displayed with:
- KPI Group: The category to which the KPI belongs.
- Unit: The unit of measurement for the KPI.
- KPI Type: Whether the KPI is “Lower the Better” or “Upper the Better.”
- Formula: The formula used to aggregate the KPI.
- Definition: A brief explanation of the KPI.

Click to buy Climate Action KPI Dashboard in Google Sheets
3. Actual Numbers Sheet Tab
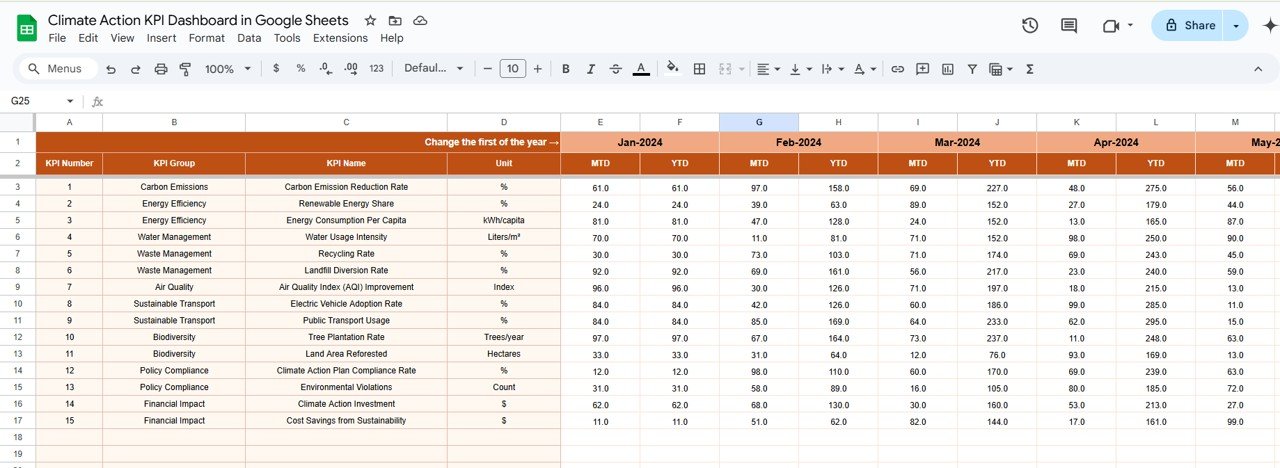
This sheet is where users enter the actual performance data for each KPI.
-
MTD and YTD Input: Enter data for MTD and YTD performance, and the sheet will calculate the differences from targets and previous years.
-
Customizable: You can change the month in range E1 to update the sheet for any given period.
4. Target Sheet Tab
The Target Sheet is used for entering the target values for each KPI, allowing you to compare actual performance against desired targets.
-
MTD and YTD Targets: Enter the target numbers for each KPI on a monthly and yearly basis.
-
Easy Tracking: This sheet makes it easy to track whether the organization is meeting its climate action goals.

Click to buy Climate Action KPI Dashboard in Google Sheets
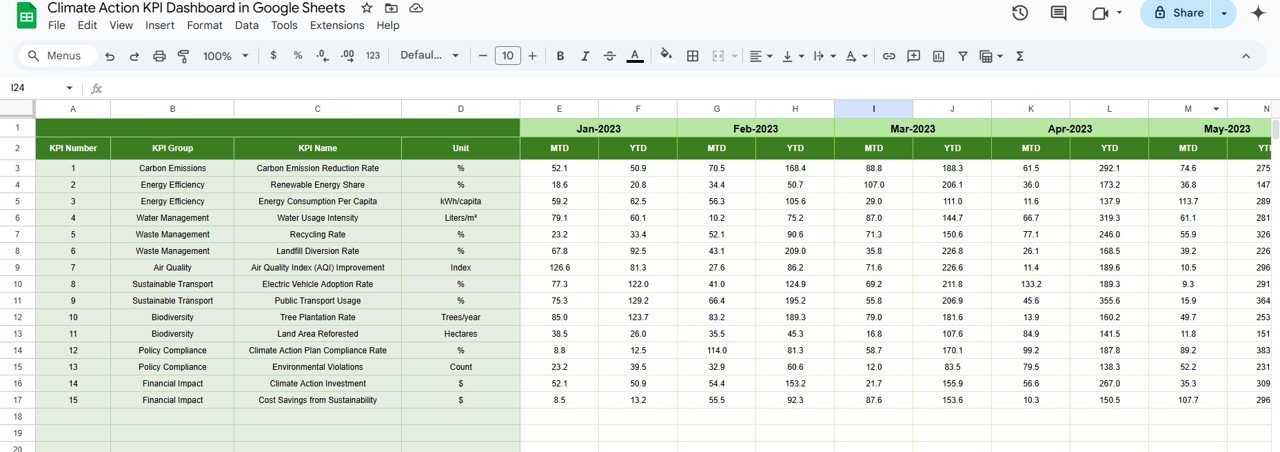
5. Previous Year Numbers Sheet Tab
In the Previous Year Numbers Sheet, users enter data for the previous year to facilitate comparisons with the current year’s performance.
-
Year-on-Year Comparison: This allows for a better understanding of progress over time and helps to identify trends or areas of improvement.
6. KPI Definition Sheet Tab
The KPI Definition Sheet serves as a reference guide for all KPIs in the dashboard.
-
Detailed Information: It includes the name, group, unit, formula, and definition for each KPI.
-
Clear Understanding: This sheet ensures that everyone involved understands the KPIs and how they are calculated.

Click to buy Climate Action KPI Dashboard in Google Sheets
Advantages of Using the Climate Action KPI Dashboard
The Climate Action KPI Dashboard provides numerous advantages to organizations committed to environmental sustainability:
- Centralized Climate Data Management: Having all climate action data in one place simplifies tracking and analysis, allowing teams to focus on strategic decision-making rather than hunting for data across multiple systems.
- Real-Time Insights: The ability to view MTD and YTD data and compare it with targets ensures that organizations can make timely adjustments to their climate action plans. Real-time data helps to address issues before they become critical.
- Customizable and Flexible: The Google Sheets template is highly customizable. Organizations can adjust the dashboard to track different KPIs, change target goals, or even modify formulas based on evolving climate strategies.
- Enhanced Accountability: By clearly defining KPIs and tracking performance against targets, the dashboard ensures accountability at all levels of the organization. Teams can quickly identify areas where they are underperforming and take corrective actions.
- Data-Driven Decision-Making: The dashboard empowers decision-makers with the data they need to evaluate the effectiveness of their climate action initiatives. The real-time, visual representation of data makes it easier to communicate performance to stakeholders.
Opportunities for Improvement in the Climate Action KPI Dashboard
While the Climate Action KPI Dashboard is a highly effective tool, there are always areas for improvement:
- Integration with External Data Sources: Automating the data entry process by integrating the dashboard with external data sources or sensors (e.g., energy meters, carbon emission tracking tools) would reduce manual data entry and improve data accuracy.
- Enhanced Predictive Analytics: Adding predictive capabilities to the dashboard, such as trend forecasting or “what-if” analysis, could provide valuable insights into future climate actions and help organizations prepare for upcoming challenges.
- Expanded KPI Library: The dashboard can be expanded to include more KPIs related to climate action, such as biodiversity preservation, green building initiatives, and sustainable supply chain metrics. This would provide a more comprehensive view of an organization’s environmental impact.
Best Practices for Using the Climate Action KPI Dashboard
Click to buy Climate Action KPI Dashboard in Google Sheets
To make the most of the Climate Action KPI Dashboard, follow these best practices:
- Keep Data Updated: Regularly update both the actual numbers and targets to ensure that the dashboard reflects the most accurate and current information.
- Set Realistic and Measurable Targets: Ensure that the targets you set for each KPI are ambitious yet achievable. They should align with both long-term climate goals and short-term action plans.
- Regularly Review Trends: Use the trend analysis functionality in the KPI Trend Sheet to identify trends over time. This will help you understand whether climate action initiatives are working or need to be adjusted.
- Involve Key Stakeholders: Encourage collaboration between departments to ensure that all teams are aligned in meeting climate action goals. Regularly review the dashboard with stakeholders to discuss progress and areas for improvement.
Frequently Asked Questions (FAQs)
What is a Climate Action KPI?
A Climate Action KPI is a metric used to measure the progress and effectiveness of an organization’s efforts to combat climate change. These KPIs can track various aspects such as energy efficiency, emissions reduction, and resource conservation.
How do I enter data into the Climate Action KPI Dashboard?
Data is entered into the dashboard through specific sheets for actual numbers, targets, and previous year data. Simply input the relevant information into the “Actual Numbers,” “Target,” and “Previous Year Numbers” sheets, and the dashboard will automatically update.
Can I customize the KPIs in the dashboard?
Yes, the Climate Action KPI Dashboard is fully customizable. You can add new KPIs, change existing ones, and modify the formulas to suit your specific needs.
How often should I update the dashboard?
To ensure that your dashboard provides real-time insights, it is recommended to update it at least monthly with the latest data for MTD and YTD performance.
Conclusion
Click to buy Climate Action KPI Dashboard in Google Sheets
The Climate Action KPI Dashboard in Google Sheets is an essential tool for organizations striving to make a positive impact on the environment. With its user-friendly design, real-time insights, and customizable features, it empowers organizations to track their progress, set meaningful targets, and take data-driven actions toward a more sustainable future.
Visit our YouTube channel to learn step-by-step video tutorials
Youtube.com/@NeotechNavigators
Watch the step-by-step video Demo: