Cloud migration has become a strategic priority for organizations across industries. Companies move workloads to the cloud to reduce infrastructure cost, improve scalability, increase security, and speed up innovation. However, cloud migration projects often fail when teams lack visibility into progress, cost, performance, and risks. Because of this challenge, businesses now rely on structured KPI dashboards instead of scattered reports.Cloud Migration KPI Dashboard in Google Sheets
A Cloud Migration KPI Dashboard in Google Sheets works as a centralized performance monitoring system. It tracks progress, timelines, costs, security, compliance, and performance throughout the migration lifecycle. Moreover, because it runs in Google Sheets, it stays simple, flexible, and accessible for all stakeholders.Cloud Migration KPI Dashboard in Google Sheets
In this article, we explain how this ready-to-use dashboard works, its worksheet structure, all key KPIs with formulas and definitions, and how organizations can use it to deliver successful cloud migration programs.Cloud Migration KPI Dashboard in Google Sheets
What Is a Cloud Migration KPI Dashboard in Google Sheets?
Click to Buy Cloud Migration KPI Dashboard in Google Sheets
A Cloud Migration KPI Dashboard is a performance management tool that monitors critical success metrics related to cloud migration projects. It helps organizations answer questions such as:
-
Are applications migrating on schedule?
-
Are costs within budget?
-
Are workloads performing better after migration?
-
Are security and compliance goals met?
-
Is cloud infrastructure optimized properly?
Instead of reviewing manual spreadsheets or technical logs, leaders get a consolidated view of migration performance using visual KPIs, trends, and comparisons.
Because this dashboard uses Google Sheets, it provides:
-
Real-time updates
-
Easy collaboration
-
Automated calculations
-
Month-wise & YTD analysis
-
Simple maintenance without coding
Key Worksheet Structure of the Dashboard
The Cloud Migration KPI Dashboard includes 6 interconnected worksheets, each designed to support complete performance tracking.
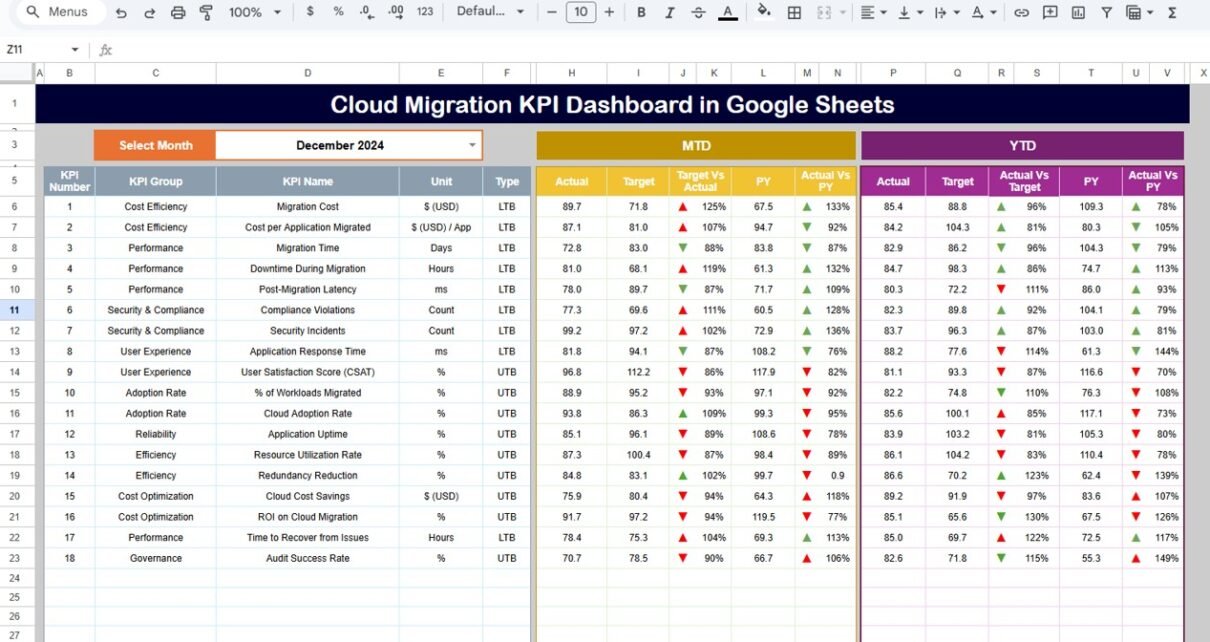
Dashboard Sheet Tab (Main Sheet)
This is the primary decision-making page.
-
In cell D3, you select the month from a dropdown.
-
As soon as you change the month, the entire dashboard updates automatically.
Metrics Displayed
MTD Section
-
MTD Actual
-
MTD Target
-
MTD Previous Year
-
Target vs Actual
-
Previous Year vs Actual
YTD Section
-
YTD Actual
-
YTD Target
-
YTD Previous Year
-
Target vs Actual
-
Previous Year vs Actual
The dashboard uses conditional formatting with up and down arrows:
-
✅ Green arrow → performance improved
-
❌ Red arrow → performance declined
This layout allows leadership to review migration health within seconds.

Click to Buy Cloud Migration KPI Dashboard in Google Sheets
KPI Trend Sheet Tab
This sheet supports deep KPI-level analysis.
-
Select the KPI name from the dropdown in cell C3.
The sheet displays:
-
KPI Group
-
KPI Unit
-
KPI Type (Lower the Better / Upper the Better)
-
KPI Formula
-
KPI Definition
It also includes a month-wise trend chart, helping teams analyze improvement patterns and identify risks early.

Click to Buy Cloud Migration KPI Dashboard in Google Sheets
Actual Number Sheet Tab
This sheet stores actual values.
-
Enter MTD Actual and YTD Actual values per KPI.
-
Select the first month of the year in cell E1.
-
The structure auto-adjusts to align months.
The dashboard refreshes instantly when teams update this sheet.

Target Sheet Tab
This sheet stores performance targets.
-
MTD Target for each KPI
-
YTD Target for each KPI
Targets allow teams to track planned vs actual progress effectively.

Click to Buy Cloud Migration KPI Dashboard in Google Sheets
Previous Year Number Sheet Tab
This sheet contains last year’s KPI values.
It enables:
-
Year-over-year comparison
-
Improvement tracking
-
Performance maturity analysis

KPI Definition Sheet Tab
This reference sheet ensures governance and clarity.
It contains:
- KPI Name
- KPI Group
- Unit
- Formula
- Definition
- KPI Type (LTB / UTB)
This sheet creates alignment across IT, cloud, finance, and leadership teams.

Click to Buy Cloud Migration KPI Dashboard in Google Sheets
Advantages of the Cloud Migration KPI Dashboard
-
Provides single-view migration tracking
-
Improves cost and timeline visibility
-
Reduces migration risks early
-
Enhances leadership confidence
-
Supports data-driven decisions
-
Works without complex tools
-
Enables real-time collaboration
Opportunities for Improvement in Cloud Migration Tracking
Click to Buy Cloud Migration KPI Dashboard in Google Sheets
-
Add cloud vendor-wise KPIs (AWS, Azure, GCP)
-
Integrate billing APIs
-
Enable workload tagging analysis
-
Add SLA breach alerts
-
Introduce application criticality scoring
Best Practices for Using the Dashboard
-
Update data monthly without delay
-
Track cost & performance together
-
Review failed migrations immediately
-
Define clear KPI targets
-
Use trend analysis for forecasting
-
Maintain KPI governance via definition sheet
Conclusion
Click to Buy Cloud Migration KPI Dashboard in Google Sheets
A Cloud Migration KPI Dashboard in Google Sheets helps organizations manage cloud transformation with clarity and confidence. It tracks progress, costs, performance, security, and ROI using structured KPIs and automated comparisons. Because it remains simple, accessible, and flexible, it becomes a powerful management tool for IT leaders, cloud teams, and business stakeholders.
Frequently Asked Questions (FAQs)
1. Who should use this dashboard?
IT leaders, cloud architects, project managers, and finance teams.
2. Can I customize KPIs?
Yes, all KPIs are fully customizable.
3. Does it support YTD comparison?
Yes, it supports both MTD and YTD analysis.
4. Is Google Sheets suitable for cloud reporting?
Yes, it supports automation, security, and collaboration.
5. Can I integrate cloud billing data later?
Yes, using Google Apps Script or APIs.
Visit our YouTube channel to learn step-by-step video tutorials
Youtube.com/@NeotechNavigators
Watch the step-by-step video tutorial: