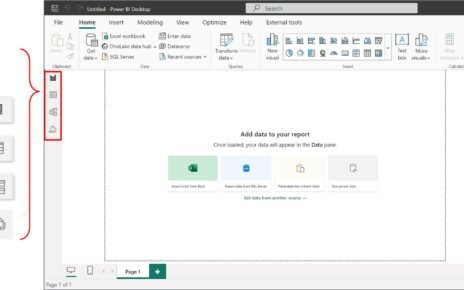
Power BI and Excel are two of the most popular tools for data analysis and visualization. While each has its strengths, combining them can unlock even more powerful insights. Connecting Power BI with Excel allows you to work with Excel data in Power BI and vice versa, making your data analysis workflow more efficient. In this article, we will guide you through the steps to connect Power BI with Excel.
Why Connect Power BI with Excel?
Integrating Power BI with Excel brings numerous benefits:
- Powerful Visualizations: Power BI offers robust data visualization capabilities that can bring your Excel data to life.
- Real-Time Data: With the connection, you can ensure that your reports in Power BI reflect the most recent changes in your Excel workbooks.
- Enhanced Analytics: Power BI’s advanced features like DAX (Data Analysis Expressions) and Power Query can be used on your Excel data, elevating your analysis.
- Collaboration: Power BI dashboards can be shared with colleagues, while Excel remains the go-to tool for detailed data manipulation.
How to Connect Power BI with Excel
There are several ways to connect Power BI to Excel. Below are the most common methods:
Importing Excel Data into Power BI
Power BI allows you to directly import Excel files and create reports based on the data in these files.
Steps:
- Open Power BI Desktop.
- Click on ‘Get Data’ in the Home ribbon.
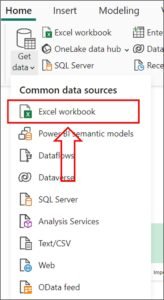
- Select ‘Excel’ from the list of available data sources.
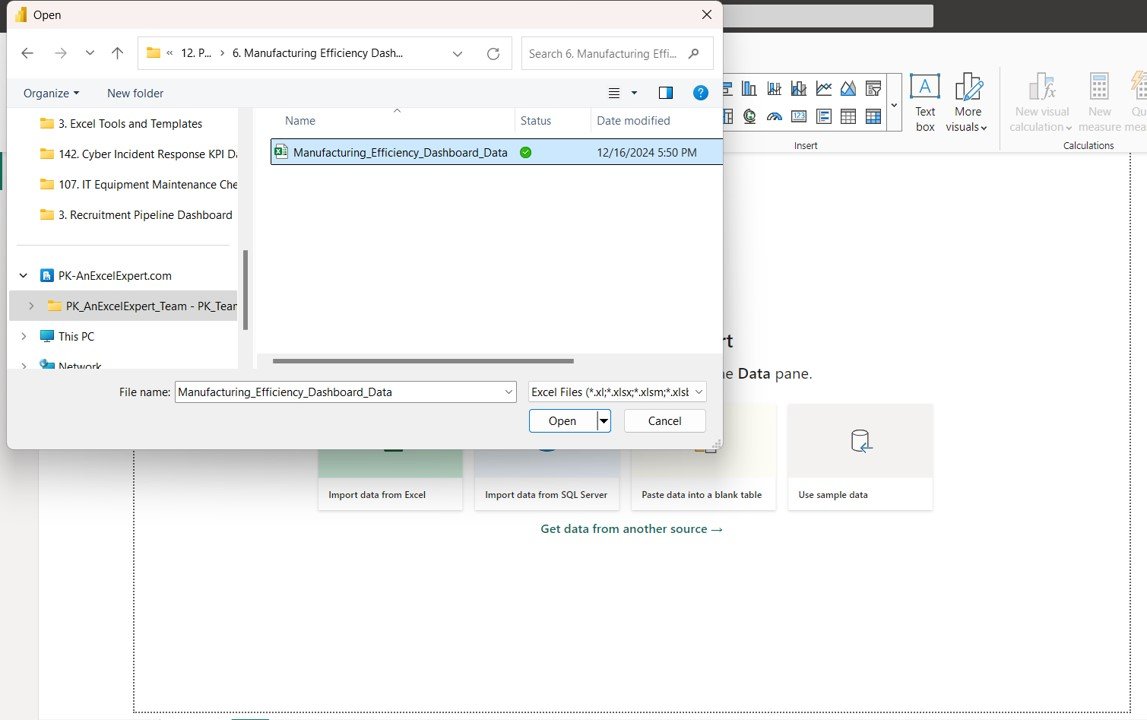
- Browse for your Excel file and click ‘Open’.
- Select the desired sheet(s) from the file to import into Power BI.
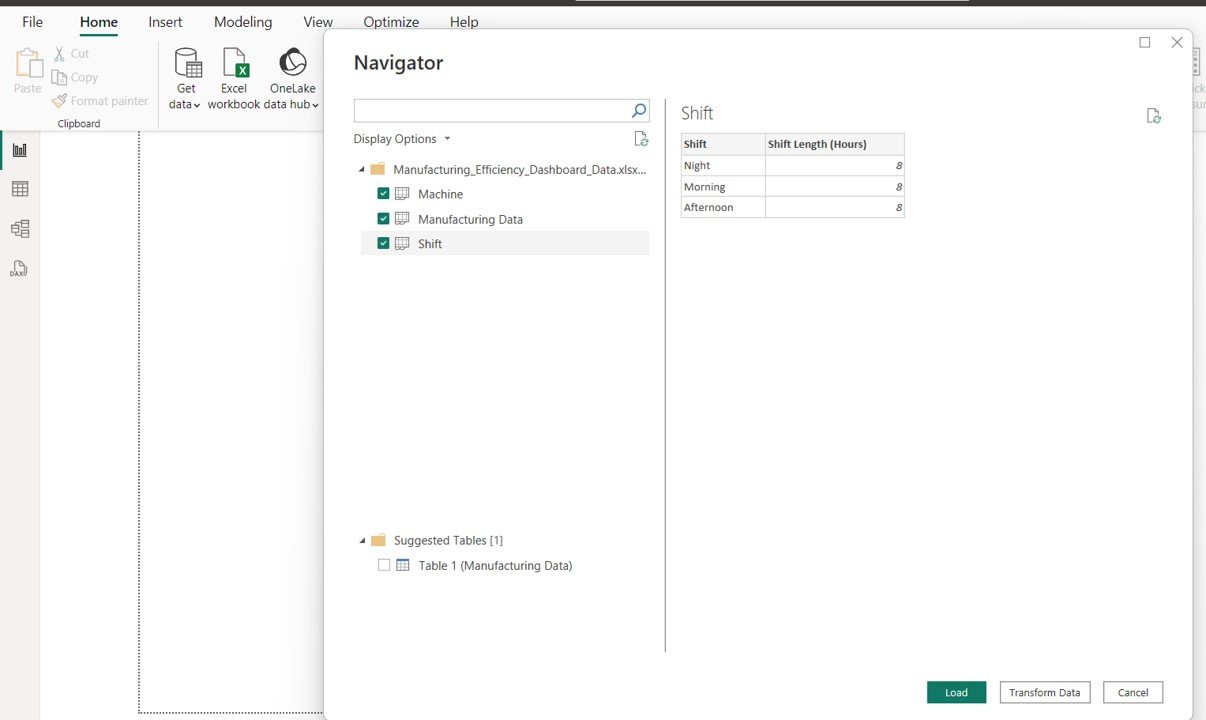
- Click Load to load the data into Power BI.
After importing, you can use Power BI’s tools to create visualizations, reports, and dashboards with your Excel data.
Using Power BI’s Excel Add-in
Power BI offers an Excel add-in, known as “Power BI Publisher for Excel,” which allows you to pin Excel elements directly to Power BI dashboards.
Steps:
- Download and install the Power BI Publisher for Excel add-in.
- Open Excel and load the data you want to publish to Power BI.
- Select the range, table, or chart you want to pin to Power BI.
- Click on the Power BI tab in the Excel ribbon and select ‘Pin to Power BI’.
- Log into your Power BI account, and the selected data will be added to your Power BI dashboard.
This method allows you to keep your Excel analysis and Power BI visualizations in sync.
Using Excel as a Data Source in Power BI Service
You can upload your Excel file to the Power BI Service and create reports directly from it.
Steps:
- Log into Power BI Service (app.powerbi.com).
- Click on ‘Get Data’ in the lower-left corner.
- Choose ‘Get’ under ‘Files’, then select ‘OneDrive – Business’ or ‘Local File’ depending on where your Excel file is stored.
- Browse for your Excel file and click ‘Connect’.
- Once connected, Power BI will create a dataset based on your Excel file, and you can begin building reports.
This approach works well if you want to work with live data from Excel in the cloud, ensuring that your Power BI reports are always up to date.

Exporting Power BI Data to Excel
If you have created a report in Power BI and need to export the data to Excel for further analysis or sharing, Power BI provides an option to export data.
Steps:
- Open the report in Power BI Service.
- Click on the ellipsis (three dots) in the upper-right corner of the visualization or report.
- Select ‘Export data’.
- Choose the file format (CSV or Excel) and click ‘Export’.
This method allows you to take the data used in your Power BI report and manipulate it further in Excel.
Real-Time Excel Data Refresh in Power BI
Once connected, you can keep your Power BI reports up to date with real-time data from your Excel file by using the “Scheduled Refresh” feature in Power BI.
Steps:
- Publish the Excel file to Power BI.
- Go to Power BI Service and select the dataset.
- Click on ‘Schedule Refresh’ under the dataset settings.
- Set the refresh frequency (daily, weekly, etc.).
- Save the refresh settings to ensure that your reports are always updated.
This feature ensures that changes in your Excel file are reflected in Power BI reports, so you can make data-driven decisions with the most current information.
Conclusion
Connecting Power BI with Excel allows you to tap into the strengths of both tools. Power BI provides robust data visualization and reporting capabilities, while Excel offers powerful data manipulation features. By integrating the two, you can seamlessly work with data, share insights, and make informed decisions based on real-time analysis.
Visit our YouTube channel to learn step-by-step video tutorials

