Construction projects depend heavily on the availability, utilization, and performance of equipment. However, many construction companies still track equipment data using manual logs, isolated spreadsheets, or delayed MIS reports. As a result, equipment downtime increases, costs rise, and productivity suffers.
That is exactly where a Construction Equipment KPI Dashboard in Google Sheets delivers real value.
In this detailed article, you will learn what a Construction Equipment KPI Dashboard in Google Sheets is, how it works, its worksheet-wise structure, key KPIs with units and formulas, advantages, best practices, and frequently asked questions. By the end of this article, you will clearly understand how this ready-to-use dashboard helps construction teams monitor equipment performance and make data-driven decisions.
What Is a Construction Equipment KPI Dashboard in Google Sheets?
Click to Buy Construction Equipment KPI Dashboard in Google Sheets
A Construction Equipment KPI Dashboard in Google Sheets is a centralized performance monitoring tool designed to track key equipment-related KPIs such as utilization, downtime, maintenance, cost, and productivity.
Instead of reviewing multiple reports or raw data, this dashboard presents all equipment KPIs in one interactive view. Moreover, because it runs on Google Sheets, teams can collaborate in real time and access insights from anywhere.
As a result, project managers, plant managers, and equipment teams gain instant visibility into equipment health and efficiency.
Why Is a Construction Equipment KPI Dashboard Important?
Equipment performance directly impacts project timelines, costs, and profitability. Therefore, tracking equipment KPIs consistently becomes essential.
Here is why a Construction Equipment KPI Dashboard matters:
-
It provides clear visibility into equipment utilization and downtime
-
It tracks performance against targets and previous year benchmarks
-
It highlights cost overruns and maintenance issues early
-
It improves accountability across equipment and maintenance teams
-
It reduces manual reporting effort
Because Google Sheets is cloud-based, all stakeholders work with the same updated data.
How Does the Construction Equipment KPI Dashboard in Google Sheets Work?
Click to Buy Construction Equipment KPI Dashboard in Google Sheets
This dashboard works by separating KPI definitions, data input, and visual analysis into structured worksheets.
First, KPI definitions define what to measure and how to measure it. Then, users enter actual numbers, targets, and previous year data. After that, the dashboard automatically calculates MTD and YTD performance. Finally, conditional formatting highlights performance using up and down arrows.
Because of this structure, users focus on insights rather than calculations.
What Worksheets Are Included in the Construction Equipment KPI Dashboard?
The Construction Equipment KPI Dashboard in Google Sheets includes six structured worksheets, each serving a specific purpose.
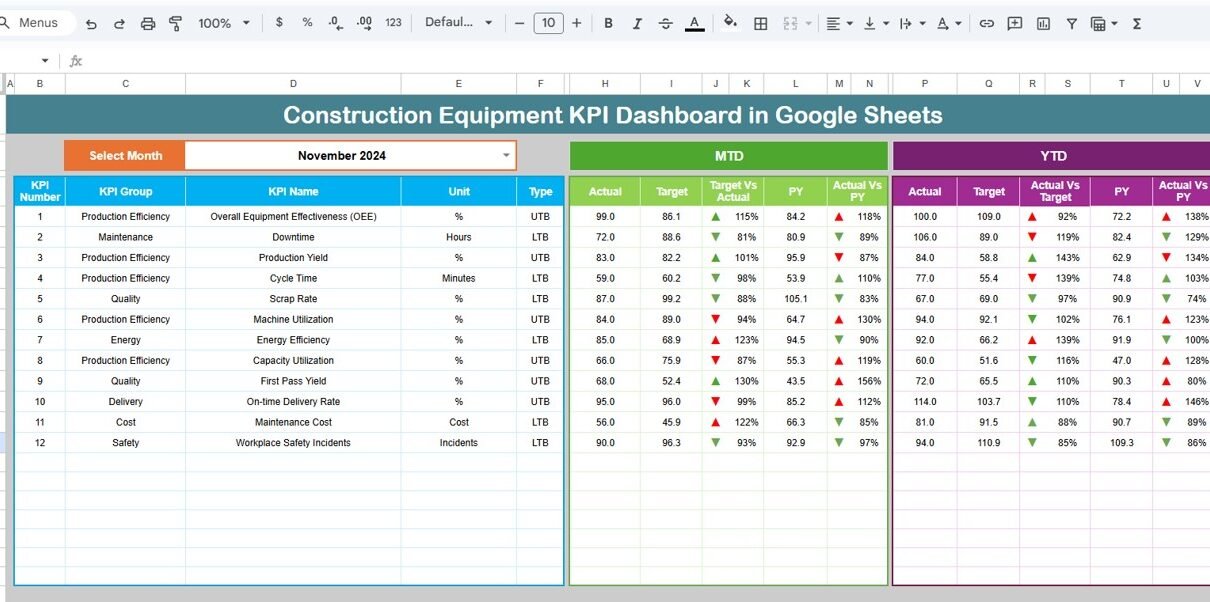
Dashboard Sheet Tab
The Dashboard Sheet Tab is the main reporting interface.
Key Features of the Dashboard Sheet
-
Month dropdown available on cell D3
-
Automatic refresh of all KPIs based on selected month
-
MTD Actual, Target, and Previous Year comparison
-
YTD Actual, Target, and Previous Year comparison
-
Target vs Actual variance with up/down arrows
-
Previous Year vs Actual variance with up/down arrows
Because everything appears on one screen, managers can review equipment performance instantly.

Click to Buy Construction Equipment KPI Dashboard in Google Sheets
KPI Trend Sheet Tab
The KPI Trend Sheet Tab provides deep insight into individual KPIs.
Key Features of the KPI Trend Sheet
-
KPI selector dropdown on cell C3
-
Displays KPI Group
-
Shows KPI Unit
-
Indicates KPI Type (Lower the Better / Upper the Better)
-
Displays KPI Formula
-
Shows KPI Definition
This sheet helps users understand KPI behavior, logic, and trends clearly.

Actual Number Sheet Tab
The Actual Number Sheet Tab captures real performance data.
Key Features
-
Month selection on cell E1
-
Entry of MTD Actual values
-
Entry of YTD Actual values
-
Structured and simple input format
Users only enter numbers, while calculations update automatically.

Click to Buy Construction Equipment KPI Dashboard in Google Sheets
Target Sheet Tab
The Target Sheet Tab defines expected equipment performance.
Key Features
-
Monthly MTD target entry
-
Monthly YTD target entry
-
KPI-wise target structure
Because targets drive performance comparison, this sheet is critical for control.

Previous Year Number Sheet Tab
The Previous Year Number Sheet Tab enables year-over-year analysis.
Key Features
-
Previous year MTD values
-
Previous year YTD values
-
Same structure as current year data
This sheet helps measure improvement and identify long-term trends.

Click to Buy Construction Equipment KPI Dashboard in Google Sheets
KPI Definition Sheet Tab
The KPI Definition Sheet Tab forms the backbone of the dashboard.
Fields Included
-
KPI Name
-
KPI Group
-
Unit
-
Formula (aggregation logic)
-
KPI Definition
-
KPI Type (Lower the Better / Upper the Better)
Because clarity matters, this sheet ensures consistent KPI understanding across teams.

Advantages of Construction Equipment KPI Dashboard in Google Sheets
Using this dashboard provides strong operational benefits.
Key Advantages
- Centralized Equipment Performance Tracking
- Clear MTD and YTD Comparison
- Target vs Actual Visibility
- Year-over-Year Performance Tracking
- Real-Time Collaboration
- No Expensive BI Tools Required
Because of these advantages, construction teams gain better control over equipment usage and cost.
Best Practices for the Construction Equipment KPI Dashboard in Google Sheets
Click to Buy Construction Equipment KPI Dashboard in Google Sheets
Follow these best practices to maximize dashboard effectiveness.
1. Keep KPI Definitions Accurate
Always maintain correct formulas and units.
2. Update Data Monthly
Consistent updates ensure reliable insights.
3. Review Negative Variances First
Focus on KPIs showing downward arrows.
4. Protect Formula Sheets
Lock calculation and dashboard sheets.
5. Align Targets with Project Goals
Set realistic and achievable equipment targets.
How Is This Dashboard Better Than Traditional Equipment Reports?
Unlike traditional reports, this dashboard:
-
Updates dynamically by month selection
-
Shows MTD and YTD in one view
-
Highlights performance gaps visually
-
Saves hours of manual reporting
Therefore, it acts as a performance management system, not just a report.
Conclusion
Click to Buy Construction Equipment KPI Dashboard in Google Sheets
A Construction Equipment KPI Dashboard in Google Sheets is a powerful and practical solution for tracking equipment performance. It combines KPI definitions, actuals, targets, and historical data into one interactive dashboard.
Moreover, its structured worksheet design, trend analysis, and visual indicators help construction teams monitor equipment performance accurately and take timely actions. By using this dashboard, construction organizations reduce downtime, control costs, and improve project efficiency.
Frequently Asked Questions (FAQs)
What is a Construction Equipment KPI Dashboard in Google Sheets?
It is an interactive dashboard that tracks construction equipment KPIs such as utilization, downtime, cost, and productivity in Google Sheets.
Does this dashboard support MTD and YTD analysis?
Yes, it shows MTD and YTD actuals, targets, and previous year comparisons.
Can I customize KPIs in this dashboard?
Yes, you can add or modify KPIs easily using the KPI Definition sheet.
Is this dashboard suitable for multiple construction sites?
Yes, it can be extended to support multiple sites or projects.
Does it require advanced Google Sheets skills?
No, it is designed for easy use with structured inputs.
Can this replace manual equipment reports?
Yes, it significantly reduces manual reporting and improves visibility.
Visit our YouTube channel to learn step-by-step video tutorials
Youtube.com/@NeotechNavigators
Watch the step-by-step video tutorial:
Click to Buy Construction Equipment KPI Dashboard in Google Sheets