Cross-selling plays a major role in increasing revenue without acquiring new customers. When businesses successfully cross-sell products or services to existing customers, they improve customer lifetime value and profit margins. However, many teams struggle to track cross-selling performance properly. They rely on raw sales reports that fail to show real insights.
A Cross-Selling KPI Dashboard in Google Sheets solves this challenge by transforming sales data into meaningful performance metrics. It helps sales leaders, marketing teams, and management track cross-sell effectiveness, identify opportunities, and improve sales strategies. Moreover, because this dashboard runs in Google Sheets, it stays flexible, collaborative, and easy to use.
What Is a Cross-Selling KPI Dashboard in Google Sheets?
Click to Buy Cross-Selling KPI Dashboard in Google Sheets
A Cross-Selling KPI Dashboard is a performance measurement tool that tracks how effectively a business sells additional or related products to existing customers. It answers questions such as:
-
How many customers purchased additional products?
-
Which products generate the highest cross-sell revenue?
-
Are cross-sell targets being achieved?
-
How does current performance compare with last year?
-
Which sales strategies need improvement?
Instead of working with scattered sales data, teams use this dashboard to view clear KPIs, trends, and targets in one place.
Because it uses Google Sheets, the dashboard offers:
-
Real-time updates
-
Automated calculations
-
MTD and YTD analysis
-
Easy customization
-
Zero dependency on costly BI tools
Key Features of the Cross-Selling KPI Dashboard
Click to Buy Cross-Selling KPI Dashboard in Google Sheets
This ready-to-use dashboard includes:
✅ Central KPI dashboard for quick decision-making
✅ Monthly and yearly performance tracking
✅ KPI trend analysis
✅ Target vs actual comparison
✅ Previous year benchmarking
✅ Clear KPI definitions for governance
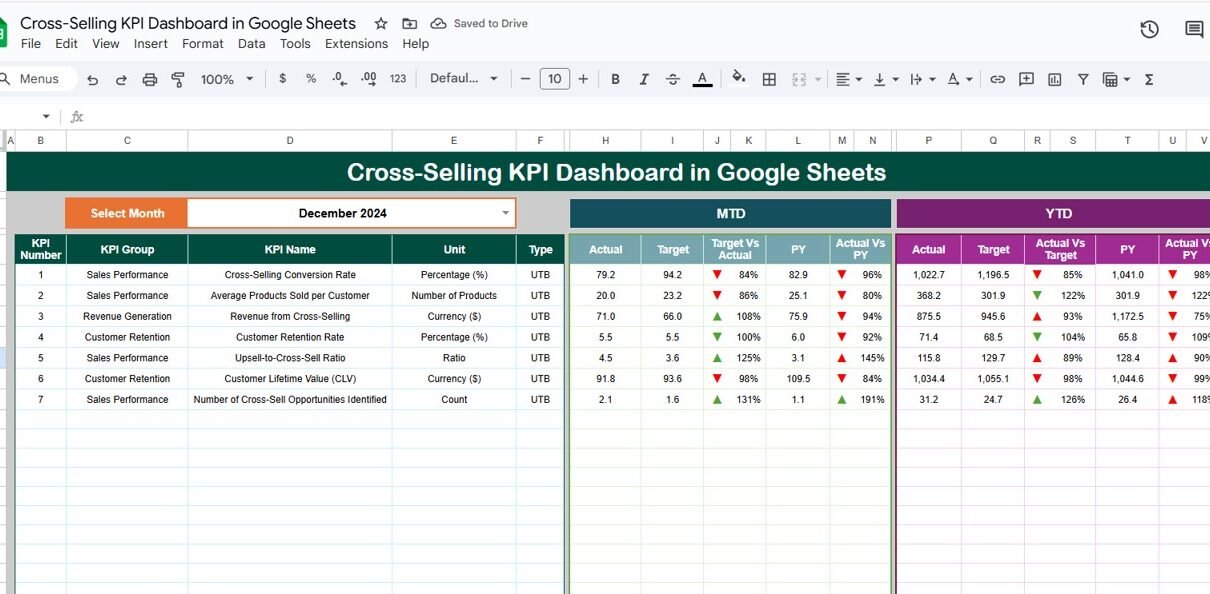
Dashboard Sheet Tab (Main Dashboard)
This is the most important page for leadership and sales managers.
-
Select the month from the dropdown in cell D3
-
All KPI values update automatically
MTD Section Includes
-
MTD Actual
-
MTD Target
-
MTD Previous Year
-
Target vs Actual
-
Previous Year vs Actual
YTD Section Includes
-
YTD Actual
-
YTD Target
-
YTD Previous Year
-
Target vs Actual
-
Previous Year vs Actual
Conditional formatting with up and down arrows highlights positive and negative performance instantly.

Click to Buy Cross-Selling KPI Dashboard in Google Sheets
KPI Trend Sheet Tab
This sheet supports in-depth KPI analysis.
-
Select a KPI from the dropdown in cell C3
The sheet displays:
-
KPI Group
-
KPI Unit
-
KPI Type (Lower the Better / Upper the Better)
-
KPI Formula
-
KPI Definition
It also shows a month-wise trend chart, which helps teams identify patterns and seasonality in cross-selling performance.

Click to Buy Cross-Selling KPI Dashboard in Google Sheets
Actual Number Sheet Tab
This sheet stores actual cross-selling values.
-
Enter MTD Actual and YTD Actual
-
Specify the first month of the year in cell E1
The dashboard refreshes automatically as soon as data updates.

Target Sheet Tab
This sheet contains cross-selling targets.
-
Monthly (MTD) targets
-
Annual (YTD) targets
Targets help teams track goal achievement clearly.

Click to Buy Cross-Selling KPI Dashboard in Google Sheets
Previous Year Number Sheet Tab
This sheet stores last year’s performance data.
It enables:
-
Year-over-year performance comparison
-
Measurement of improvement impact
-
Long-term trend analysis

KPI Definition Sheet Tab
This sheet acts as a KPI reference guide.
It contains:
-
KPI Name
-
KPI Group
-
Unit
-
Formula
-
Definition
-
KPI Type (LTB / UTB)
This ensures consistency across teams.

Click to Buy Cross-Selling KPI Dashboard in Google Sheets
Advantages of the Cross-Selling KPI Dashboard
Clear visibility into cross-selling performance
Improved revenue optimization
Better product bundling strategies
Data-driven sales planning
Faster decision-making
Easy collaboration in Google Sheets
Opportunities for Improvement
-
Integrate CRM or POS data automatically
-
Add customer segmentation analysis
-
Track channel-wise cross-sell performance
-
Use predictive analytics for recommendations
-
Add AI-driven product pairing insights
Best Practices for Using the Cross-Selling KPI Dashboard
Click to Buy Cross-Selling KPI Dashboard in Google Sheets
Update sales data regularly
Review MTD and YTD trends together
Analyze missed opportunities carefully
Align sales incentives with KPIs
Focus on high-margin cross-sell products
Keep KPI definitions consistent
Conclusion
A Cross-Selling KPI Dashboard in Google Sheets helps businesses unlock hidden revenue opportunities within their existing customer base. It measures effectiveness, highlights gaps, and supports data-driven selling strategies. Because the dashboard stays simple, flexible, and collaborative, it empowers sales and marketing teams to improve performance without complex tools.
Frequently Asked Questions (FAQs)
Click to Buy Cross-Selling KPI Dashboard in Google Sheets
1. Who should use this dashboard?
Sales managers, marketing teams, account managers, and leadership.
2. Can KPIs be customized?
Yes, all KPIs are fully editable.
3. Does this dashboard support MTD and YTD tracking?
Yes, it includes both views.
4. Can I track cross-selling by product or agent?
Yes, additional fields can be added easily.
5. Is Google Sheets secure for sales data?
Yes, with proper access control.
Visit our YouTube channel to learn step-by-step video tutorials
Youtube.com/@NeotechNavigators
Watch the step-by-step video tutorial: