Customer onboarding plays a critical role in building long-term relationships, improving customer satisfaction, and reducing churn. When onboarding processes lack visibility, teams struggle to track progress, delays increase, and customers lose confidence early in the journey. Because of this, organizations need a structured and data-driven way to monitor onboarding performance.Customer Onboarding Dashboard in Google Sheets
A Customer Onboarding Dashboard in Google Sheets provides a powerful yet simple solution. It helps teams track onboarding status, duration, customer satisfaction, and progress across industries, locations, and onboarding stages—all in one centralized dashboard.
This article explains how this ready-to-use dashboard works, what insights it provides, and how organizations can use it to improve onboarding efficiency and customer experience.Customer Onboarding Dashboard in Google Sheets
What Is a Customer Onboarding Dashboard in Google Sheets?
A Customer Onboarding Dashboard is a visual reporting system that tracks how new customers move through onboarding stages. It monitors completion rates, drop-offs, timelines, and satisfaction scores.
Because this dashboard runs in Google Sheets, it offers:
- Real-time collaboration
- Automatic calculations
- Interactive charts
- Easy filtering and search
- No need for expensive onboarding software
As a result, customer success teams, sales teams, and operations teams gain complete visibility into onboarding performance.
Why Do Businesses Need a Customer Onboarding Dashboard?
Click to Buy Customer Onboarding Dashboard in Google Sheets
Customer onboarding directly affects retention and lifetime value. When teams monitor onboarding effectively, they can:
- Reduce onboarding delays
- Improve customer satisfaction (CSAT)
- Identify bottlenecks early
- Compare performance across industries and locations
- Improve internal accountability
Therefore, a structured onboarding dashboard becomes essential for growing organizations.
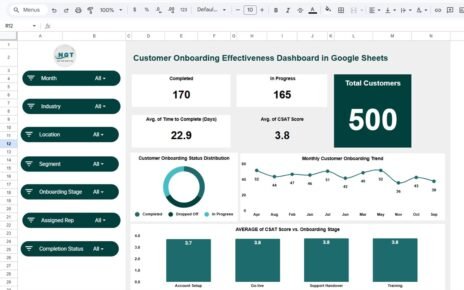
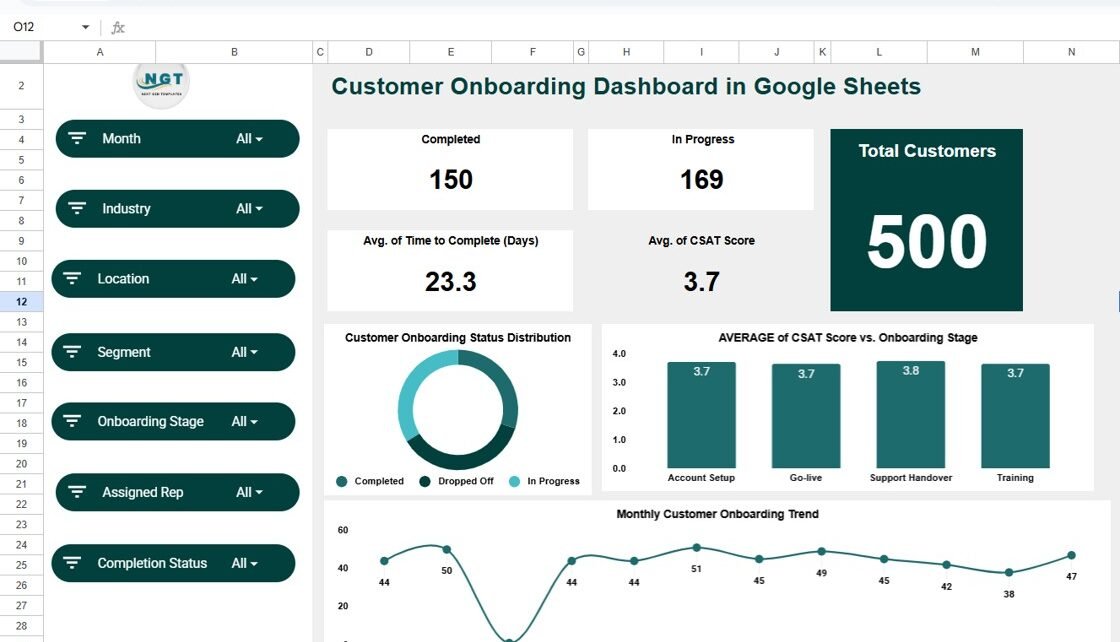
Overview Sheet Tab – Executive Summary
The Overview sheet gives a high-level snapshot of onboarding performance. It allows leadership to understand the current state instantly.
Key KPI Cards
The dashboard includes the following KPI cards:
-
Completed – Total customers who finished onboarding
-
In Progress – Customers currently in onboarding
-
Average Time to Complete (Days) – Average onboarding duration
-
Average CSAT Score – Customer satisfaction during onboarding
-
Total Customers – Overall onboarding volume
These KPIs help teams evaluate efficiency and customer experience at a glance.
Overview Charts
Customer Onboarding Status Distribution
Shows how customers split between Completed, In Progress, and Dropped Off. This chart highlights onboarding health immediately.
Average CSAT Score vs. Onboarding Stage
Displays customer satisfaction at different onboarding stages. It helps teams identify stages that create friction.
Monthly Customer Onboarding Trend
Tracks onboarding volume month by month, which helps teams plan capacity and forecast workload.

Click to Buy Customer Onboarding Dashboard in Google Sheets
Industry Analysis Sheet
The Industry Analysis section helps organizations compare onboarding performance across different industries.
Charts Included
-
Customer Onboarding by Industry
-
Average Duration (Days) by Industry
-
Completed, Dropped Off, and In Progress by Industry
-
Average CSAT Score by Industry
These insights help teams understand which industries require more effort, longer timelines, or additional support.

Click to Buy Customer Onboarding Dashboard in Google Sheets
Location Analysis Sheet
The Location Analysis section highlights regional onboarding performance.
Charts Included
-
Customer Onboarding by Location
-
Average Duration (Days) by Location
-
Completed, Dropped Off, and In Progress by Location
-
Average CSAT Score by Location
This analysis helps organizations improve onboarding processes for specific regions and adjust resources accordingly.

Click to Buy Customer Onboarding Dashboard in Google Sheets
Onboarding Stage Analysis Sheet
This section focuses on each step of the onboarding journey.
Charts Included
-
Average Duration (Days) by Onboarding Stage
-
Customer Onboarding by Onboarding Stage
-
Completed, Dropped Off, and In Progress by Stage
-
Average CSAT Score by Onboarding Stage
With this view, teams can identify bottlenecks and optimize specific stages that slow down onboarding.

Click to Buy Customer Onboarding Dashboard in Google Sheets
Monthly Trends Analysis Sheet
The Monthly Trends section tracks how onboarding performance evolves over time.
Charts Included
-
Average CSAT Score by Month
-
Completed, Dropped Off, and In Progress by Month
-
Average Duration (Days) by Month
These trends help leadership measure improvement and identify seasonal challenges.

Click to Buy Customer Onboarding Dashboard in Google Sheets
Advantages of Customer Onboarding Dashboard in Google Sheets
1. Complete Visibility
Teams see onboarding progress, delays, and satisfaction in real time.
2. Faster Decision-Making
Clear KPIs and charts help managers act quickly.
3. Improved Customer Experience
Teams identify friction points and improve onboarding journeys.
4. Easy Collaboration
Multiple users can update and review data simultaneously.
5. Cost-Effective Solution
Google Sheets removes the need for expensive onboarding tools.
6. Highly Customizable
Organizations can add industries, locations, or stages easily.
Opportunities for Improvement in Customer Onboarding
Click to Buy Customer Onboarding Dashboard in Google Sheets
Although the dashboard is powerful, teams can enhance it further by:
-
Adding SLA tracking for onboarding timelines
-
Introducing automated email reminders
-
Including onboarding owner performance metrics
-
Tracking onboarding cost per customer
-
Adding customer feedback comments analysis
These improvements make onboarding even more efficient and customer-focused.
Best Practices for Using the Customer Onboarding Dashboard
-
Update onboarding data regularly
-
Standardize onboarding stages
-
Review CSAT trends weekly
-
Focus on drop-off analysis
-
Compare performance across industries and locations
-
Use insights during customer success meetings
By following these practices, teams maximize the dashboard’s value.
Conclusion
Click to Buy Customer Onboarding Dashboard in Google Sheets
A Customer Onboarding Dashboard in Google Sheets helps organizations deliver a smooth, consistent, and customer-focused onboarding experience. It provides real-time visibility into progress, timelines, and satisfaction while remaining simple and cost-effective. With powerful charts, smart search, and structured analysis, this dashboard becomes an essential tool for customer success teams and leadership.
Frequently Asked Questions (FAQs)
1. Who should use a Customer Onboarding Dashboard?
Customer success teams, sales teams, operations teams, and leadership.
2. Can this dashboard handle multiple industries and locations?
Yes, it supports unlimited industries and locations.
3. Is Google Sheets secure for customer onboarding data?
Yes, when proper access controls are applied.
4. Can I customize onboarding stages?
Absolutely, all stages are fully customizable.
5. Does the dashboard support trend analysis?
Yes, monthly and stage-wise trends are built in.
6. Do I need technical skills to use it?
No, basic Google Sheets knowledge is enough.
Visit our YouTube channel to learn step-by-step video tutorials
Youtube.com/@NeotechNavigators
Watch the step-by-step video tutorial: