Introduction
Customer Satisfaction Dashboard in HTML is an interactive, browser-based analytics template designed to help customer service teams, quality assurance professionals, and business leaders monitor, analyze, and optimize customer satisfaction metrics from a single centralized dashboard. In today’s competitive landscape, understanding how your customers feel about your service is not just a nice-to-have — it is a strategic necessity that directly impacts retention, loyalty, and revenue growth.
Whether you manage a customer support center, run a retail business, or oversee client services at an agency, this HTML dashboard transforms your raw ticket and survey data into beautiful, actionable visual insights. No complex software installation is needed — just open the file in any web browser and start analyzing your customer satisfaction data immediately. With dynamic KPI cards, interactive charts, smart filters, and multi-tab navigation, this template delivers everything you need to stay on top of your customer experience performance.
Click to buy Customer Satisfaction Dashboard in HTML
Customer Satisfaction Dashboard – Overview
Key Features of Customer Satisfaction Dashboard in HTML
This Customer Satisfaction Dashboard in HTML comes packed with powerful analytics features that rival enterprise-grade BI tools:
- Comprehensive KPI Cards — Track Total Tickets, Average Satisfaction Score, Resolution Rate, Average Response Time, Average Resolution Time, and SLA Breach Rate all in one overview page.
- Interactive Charts and Visualizations — Analyze satisfaction performance through charts such as Satisfaction Score by Region, Tickets by Issue Type, Tickets by Department, Ticket Status Distribution, and Satisfaction Score by Department.
- Channel Insights — Compare Ticket Volume, Satisfaction Score, Response Time, Resolution Time, and SLA Breach Rate across all support channels.
- SLA Performance Tracking — Monitor First Response SLA, Resolution SLA, and breach rates by department, region, and issue type.
- Time-Based Trend Analysis — Track monthly ticket volume trends, satisfaction trends, yearly comparisons, and SLA breach rate patterns over time.
- Smart Filters and Slicers — Filter data instantly by department, service channel, region, time period, and issue type to focus on the metrics that matter most.
- Multi-Tab Navigation — Switch between Overview, Channel Insights, SLA Performance, Time Analysis, and Data View using smooth tab-based navigation.
- Browser-Based — No Software Needed — Runs entirely in Chrome, Firefox, Edge, or Safari without any plugins or installations.
- Data View with CSV Export — Access a searchable, sortable data table with pagination and export functionality for deeper analysis.
- Professional SaaS-Style Design — Clean, modern interface that looks like a premium analytics dashboard application.
Dashboard Pages Explanation
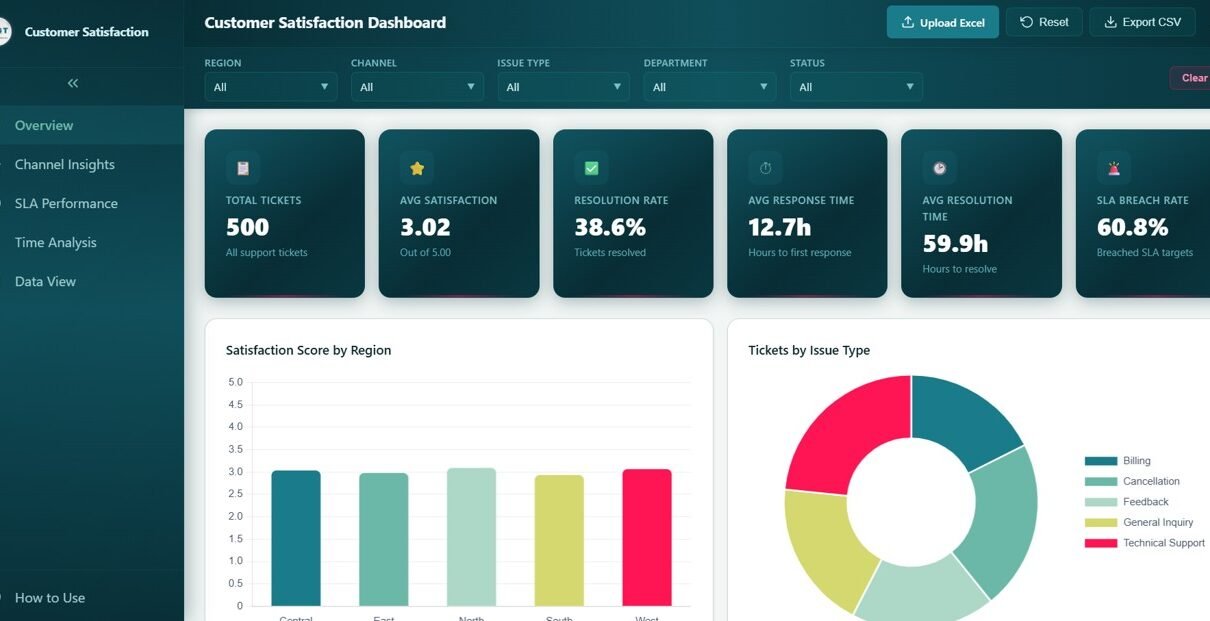
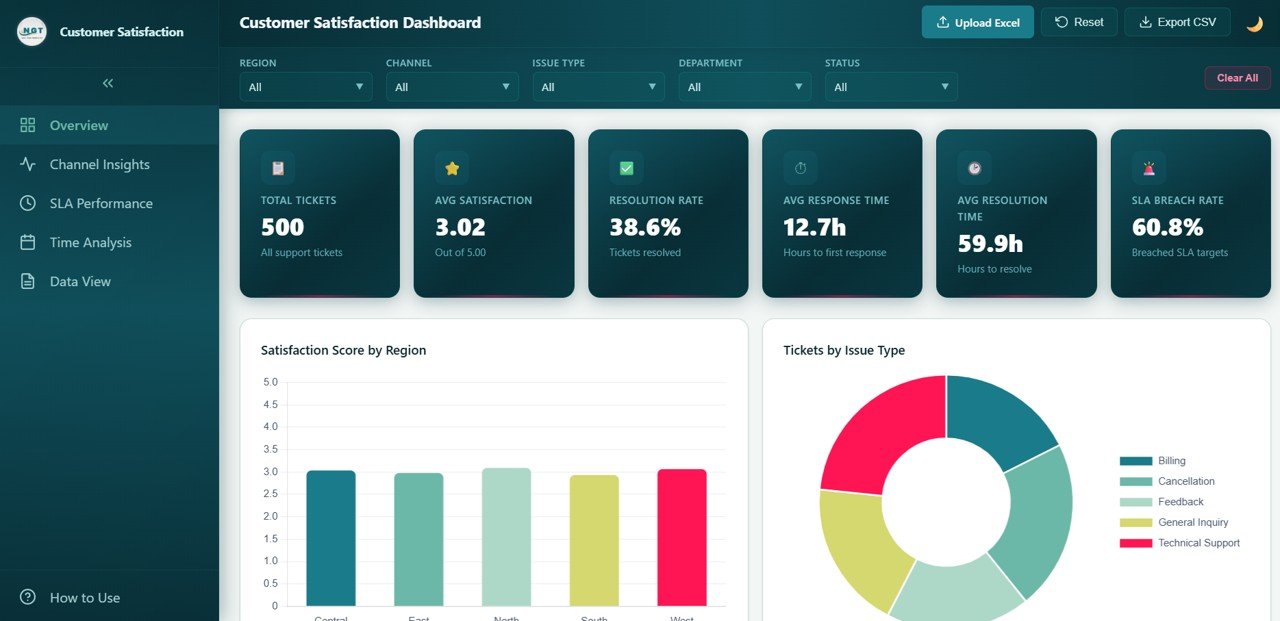
1 — Overview Page
The Overview Page is your high-level command center for customer satisfaction monitoring. At the top, dynamic KPI cards display Total Tickets, Average Satisfaction Score, Resolution Rate, Average Response Time, Average Resolution Time, and SLA Breach Rate. Below these cards, interactive charts present the key analytical views. Satisfaction Score by Region shows how customer happiness varies across different geographic areas, helping you identify regions that need extra attention. Tickets by Issue Type breaks down the most common complaint categories so your team can prioritize resources where they matter most. Tickets by Department reveals how the support workload is distributed across your organizational teams. Ticket Status Distribution displays the proportion of open, closed, in-progress, and pending tickets at any point. Satisfaction Score by Department compares how well each department is performing in terms of customer experience. Multiple slicers allow you to apply filters and see the filtered dashboard instantly.
Customer Satisfaction Dashboard – Overview
Click to buy Customer Satisfaction Dashboard in HTML
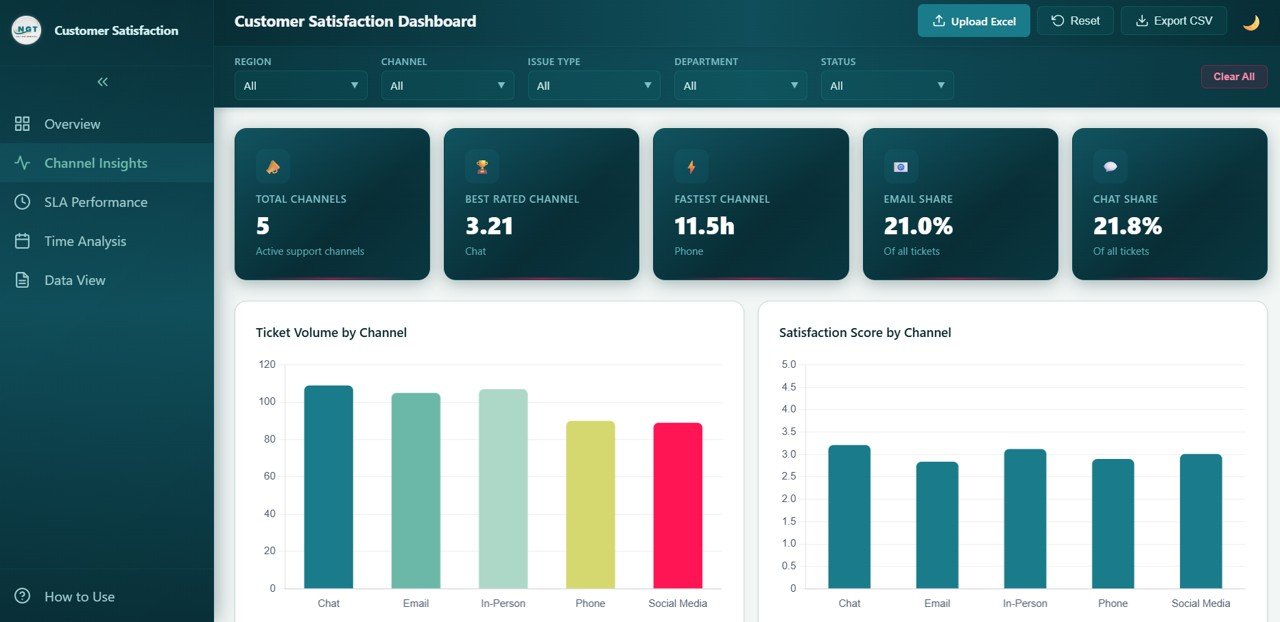
2 — Channel Insights
The Channel Insights page provides a comprehensive analysis of how each customer support channel is performing. Ticket Volume by Channel reveals which support channels such as phone, email, chat, and social media receive the most customer inquiries, helping you allocate resources effectively. Satisfaction Score by Channel compares how happy customers are with the service they receive through each communication channel. Response Time by Channel identifies which channels deliver the fastest initial replies to customer queries. Resolution Time by Channel measures the end-to-end time it takes to fully resolve customer issues per channel. SLA Breach Rate by Channel highlights which channels are struggling the most with meeting service level agreements, enabling targeted process improvements. This page is critical for optimizing your multichannel support strategy. Explore our Telecommunications Dashboard in HTML for similar channel-based analytics.
Channel Insights
Click to buy Customer Satisfaction Dashboard in HTML
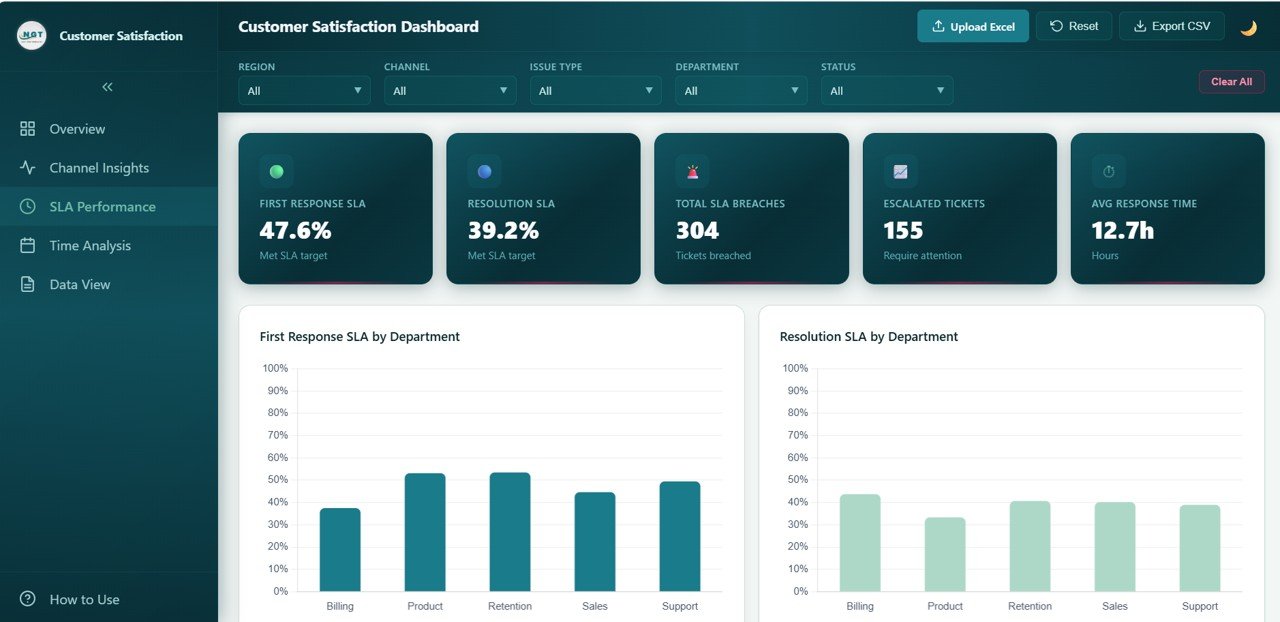
3 — SLA Performance
The SLA Performance page lets you evaluate your organization’s service level agreement compliance in detail. First Response SLA by Department tracks how quickly each team responds to the initial customer contact, ensuring no department falls behind on the first impression. Resolution SLA by Department measures how well each team adheres to the agreed resolution timeframes from start to finish. SLA Breach Rate by Region identifies geographic locations where SLA violations are most frequent, pointing to potential staffing or infrastructure issues. SLA Breach Rate by Issue Type reveals which problem categories consistently cause the most SLA breaches, helping prioritize process fixes. Response vs Resolution Time by Department provides a side-by-side comparison of how fast teams reply versus how fast they actually close tickets, exposing bottlenecks between acknowledgment and resolution.
Click to buy Customer Satisfaction Dashboard in HTML
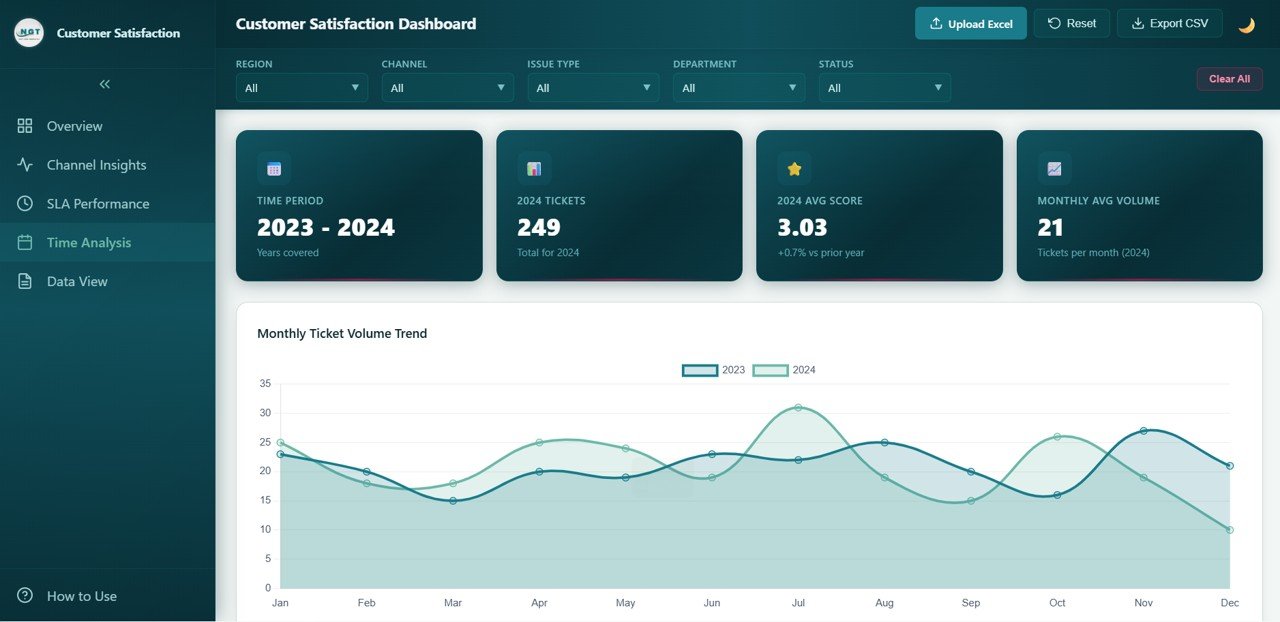
4 — Time Analysis
The Time Analysis page reveals how your customer satisfaction metrics evolve over time, providing the temporal perspective essential for strategic planning. Monthly Ticket Volume Trend tracks how the number of support requests fluctuates month by month, helping you identify seasonal peaks and plan staffing accordingly. Monthly Satisfaction Trend reveals whether your customer happiness scores are improving, declining, or remaining stable over time. Ticket Volume by Year provides a high-level comparison of annual support workload, enabling you to measure growth impact on customer service operations. Monthly SLA Breach Rate Trend spots recurring patterns in service level compliance failures, allowing proactive resource planning before breach rates spike.
Time Analysis
Click to buy Customer Satisfaction Dashboard in HTML
5 — Data View
The Data View page is a detailed data table where you can see all the records with search, sort, and pagination features. This page gives you full transparency into every individual ticket record in your dataset. You can search for specific tickets, sort by any column, navigate through pages of data, and export the filtered data to CSV for further analysis, auditing, or integration with other reporting tools.
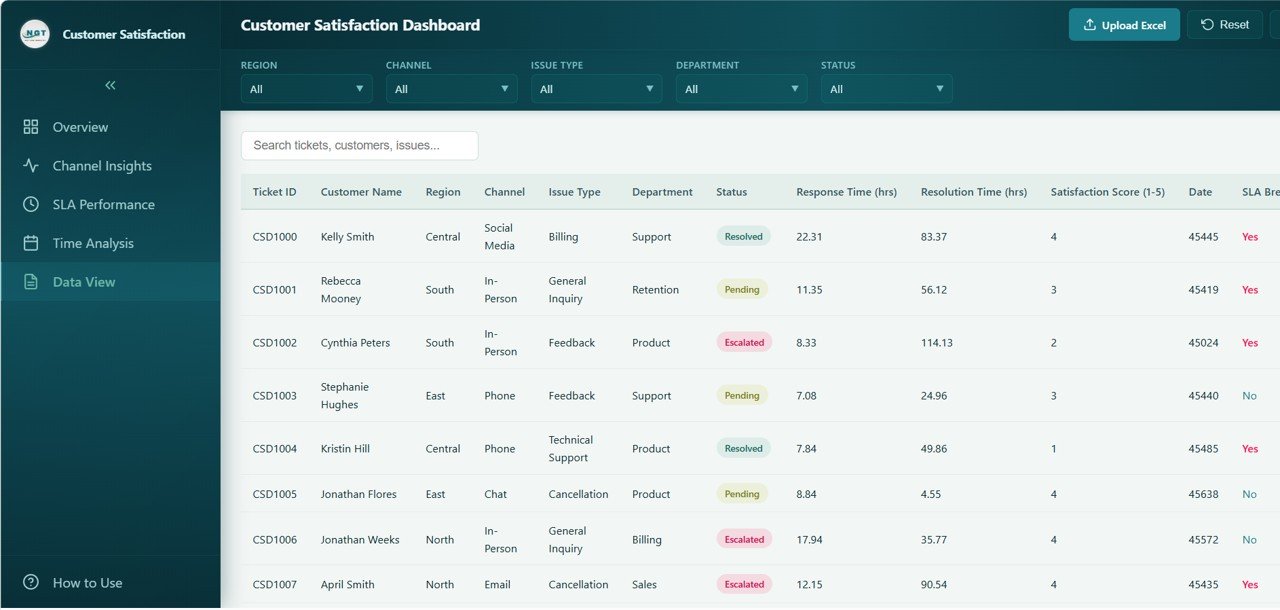
Data View
Click to buy Customer Satisfaction Dashboard in HTML
Advantages of Customer Satisfaction Dashboard in HTML
- Zero Software Dependencies — Unlike Excel or Power BI dashboards, this HTML template requires no software installation whatsoever. Just open it in a browser and start using it.
- Instant Visual Clarity — Complex satisfaction and SLA data is transformed into intuitive charts and KPI cards that anyone can understand at a glance.
- Cost-Effective Solution — Get enterprise-grade customer satisfaction analytics without investing in expensive BI platforms or custom development.
- Fully Customizable — Replace sample data with your actual ticket and survey data and customize the dashboard to match your specific business needs.
- Multi-Dimensional Analysis — Analyze satisfaction across departments, channels, regions, time periods, and issue types from one interface.
- SLA Compliance Visibility — Dedicated SLA Performance page provides the depth needed to ensure your team consistently meets service commitments.
- Professional Presentation Ready — The SaaS-style design makes it perfect for executive presentations, board meetings, and stakeholder reviews.
Opportunities for Improvement
- Real-Time Data Integration — Currently works with static data; connecting to a live API or ticketing system like Zendesk or Freshdesk would enable real-time monitoring.
- Automated SLA Alerts — Adding threshold-based notifications when SLA breach rates exceed acceptable levels would enhance proactive management.
- Sentiment Analysis Layer — Integrating text-based sentiment analysis from open-ended ticket comments would add another dimension to satisfaction insights.
- Agent-Level Drill-Down — Adding individual agent performance tracking would benefit contact center operations and personalized coaching.
- Benchmarking Module — Including industry benchmark comparisons would help organizations understand where they stand relative to competitors.
Best Practices
- Update Data Regularly — Refresh your dashboard with new ticket data weekly or monthly to keep insights current and actionable.
- Set SLA Targets — Define clear SLA targets for each department and channel, and use the SLA Performance page to track compliance against those benchmarks.
- Share with Stakeholders — Distribute the dashboard file to department heads and team leads so everyone has visibility into customer satisfaction performance.
- Focus on High-Breach Areas — Use the SLA Performance page to identify which departments, regions, and issue types have the highest breach rates, then prioritize those for improvement.
- Monitor Trends, Not Just Snapshots — Use the Time Analysis page to understand whether your satisfaction initiatives are producing sustained improvement over time.
- Combine with Other Dashboards — Pair this template with the Inventory Management Dashboard in HTML or other HTML Dashboard templates for a comprehensive business analytics suite.
Explore Relevant Templates
If you found this Customer Satisfaction Dashboard in HTML useful, check out these related templates from NextGenTemplates:
- Hospitality Dashboard in HTML — Track hotel revenue, occupancy, guest satisfaction, and booking performance.
- Telecommunications Dashboard in HTML — Monitor telecom tickets, service analysis, and technician performance.
- Inventory Management Dashboard in HTML — Track stock levels, supplier performance, and warehouse analytics.
FAQs
What software do I need to use this Customer Satisfaction Dashboard in HTML?
You do not need any special software. This dashboard runs entirely in your web browser — just open the HTML file in Chrome, Firefox, Edge, or Safari and start exploring the data immediately.
Can I replace the sample data with my own customer ticket data?
Yes, the dashboard is fully customizable. You can replace the embedded sample data with your actual customer ticket and satisfaction survey data to generate insights specific to your organization.
What KPIs are tracked in this dashboard?
The dashboard tracks Total Tickets, Average Satisfaction Score, Resolution Rate, Average Response Time, Average Resolution Time, and SLA Breach Rate, along with detailed breakdowns by department, channel, region, and issue type.
Does this dashboard include SLA tracking?
Yes, there is a dedicated SLA Performance page that tracks First Response SLA by Department, Resolution SLA by Department, SLA Breach Rate by Region, SLA Breach Rate by Issue Type, and Response vs Resolution Time by Department.
Can I export data from this dashboard?
Yes, the Data View page includes search, sort, pagination, and CSV export functionality so you can extract detailed ticket records for further analysis or reporting.
Who is this dashboard designed for?
This dashboard is perfect for customer service managers, quality assurance teams, business owners, contact center supervisors, CX professionals, and anyone who needs to track and improve customer satisfaction and SLA compliance metrics.
Conclusion
The Customer Satisfaction Dashboard in HTML is the ideal solution for organizations that want to take control of their customer experience analytics without the complexity and cost of traditional BI tools. With its professional SaaS-style design, interactive charts, smart filters, and five dedicated analysis pages covering Overview, Channel Insights, SLA Performance, Time Analysis, and Data View, this dashboard puts all your critical satisfaction and service level data at your fingertips. Whether you are tracking satisfaction trends, comparing channel performance, monitoring SLA compliance, or analyzing departmental effectiveness, this template gives you the visual clarity and analytical depth you need to drive real improvements in customer happiness and operational efficiency.
Click here to Purchase Customer Satisfaction Dashboard in HTML
Visit our YouTube channel for step-by-step tutorials: Youtube.com/@NeoTechNavigators
For more resources on building effective customer satisfaction programs, check out Google Forms documentation for creating surveys and Microsoft Power BI documentation for advanced data visualization techniques.
Click to buy Customer Satisfaction Dashboard in HTML