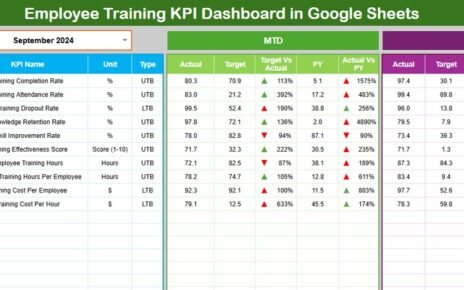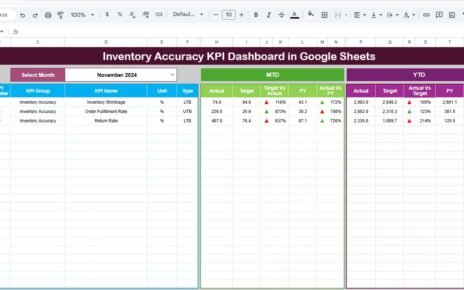
Data centers are the backbone of digital infrastructure, supporting everything from enterprise applications to cloud services. To operate efficiently, safely, and reliably, data centers must monitor key performance indicators (KPIs) related to uptime, energy efficiency, cooling performance, asset usage, and service quality.Data Center KPI Dashboard in Google Sheets
The Data Center KPI Dashboard in Google Sheets is a ready-to-use, automated tool that provides complete visibility into monthly (MTD) and yearly (YTD) performance, target comparisons, and trend analytics.Data Center KPI Dashboard in Google Sheets
This article explains all dashboard features and provides a full KPI Definition Table for your template.Data Center KPI Dashboard in Google Sheets
What Is a Data Center KPI Dashboard in Google Sheets?
A Data Center KPI Dashboard is a Google Sheets–based analytical dashboard designed for data center managers, IT operations, facility teams, and business leaders.
It helps track metrics such as:
-
Uptime
-
Server utilization
-
Power usage effectiveness (PUE)
-
Cooling efficiency
-
Incident response
-
Network latency
-
Ticket resolution
The dashboard automatically updates charts and KPI cards using targets, actuals, and previous year values.
Dashboard Structure
Click to Buy Data Center KPI Dashboard in Google Sheets
Your Data Center KPI Dashboard includes the following worksheets:
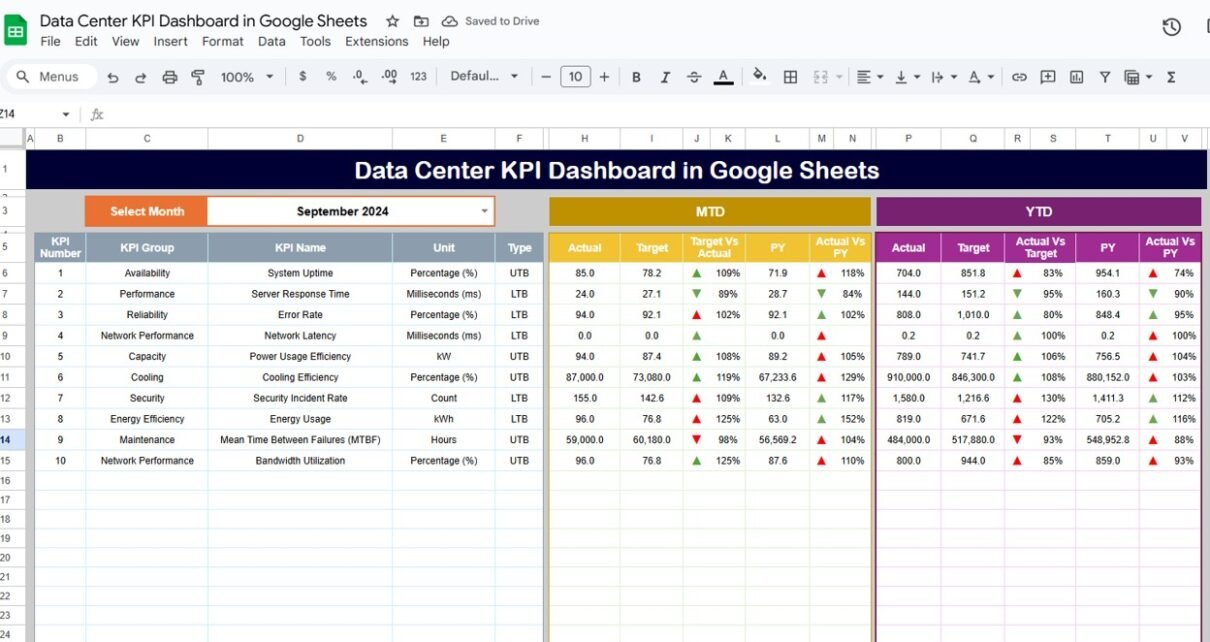
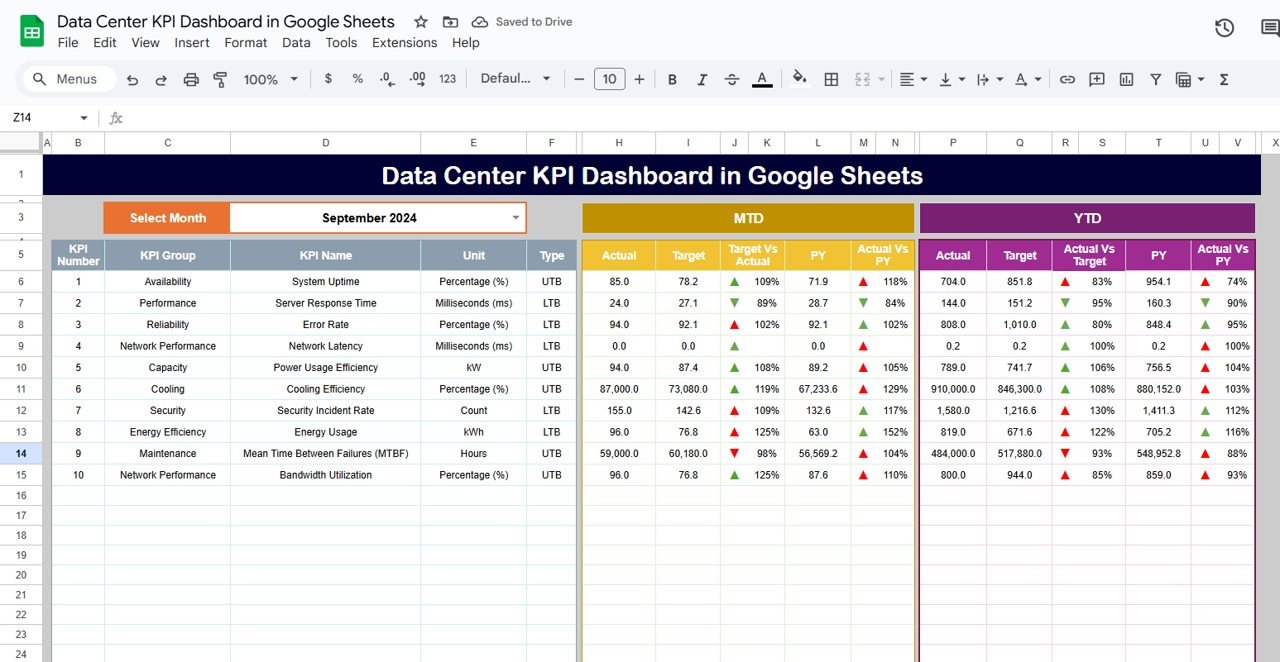
Dashboard Sheet Tab
This is the primary view, showing all KPIs for the selected month.
✔ Features:
-
Month dropdown (Cell D3)
-
MTD Actual vs Target vs Previous Year
-
YTD Actual vs Target vs Previous Year
-
Conditional formatting with:
-
Up/Down arrows
-
Red/Yellow/Green indicators
-
It gives a quick snapshot of overall performance.
Click to Buy Data Center KPI Dashboard in Google Sheets
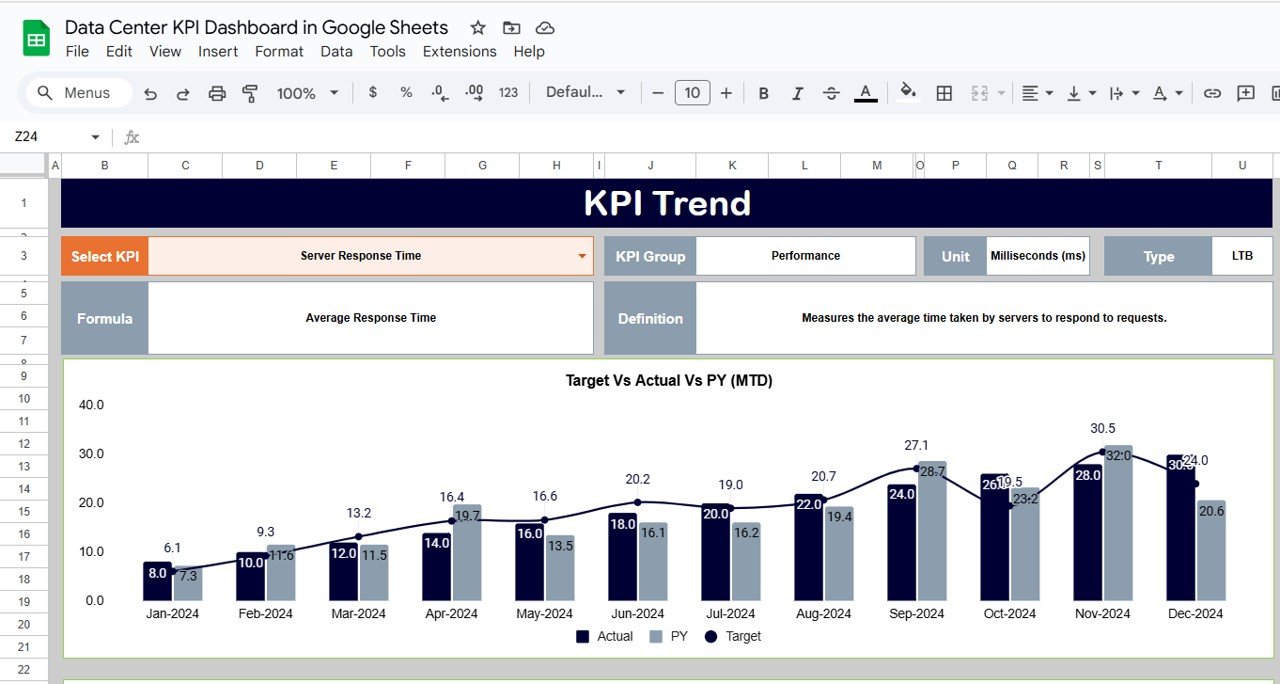
KPI Trend Sheet Tab
Shows KPI-level details based on selection in Cell C3.
Displays:
-
KPI Name
-
KPI Group
-
Unit
-
Type (Lower the Better / Upper the Better)
-
KPI Formula
-
KPI Definition
-
Trend Chart for MTD & YTD
Click to Buy Data Center KPI Dashboard in Google Sheets
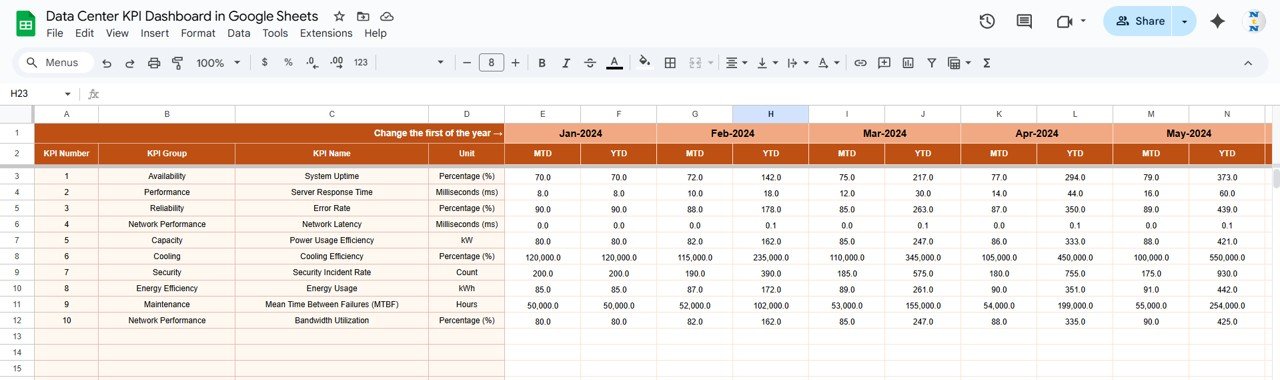
Actual Number Sheet Tab
Enter MTD and YTD Actual values for all KPIs.
You can set the year start month in Cell E1.
Target Sheet Tab
Enter monthly Target values for all KPIs.
Used to calculate Target vs Actual performance.
Click to Buy Data Center KPI Dashboard in Google Sheets
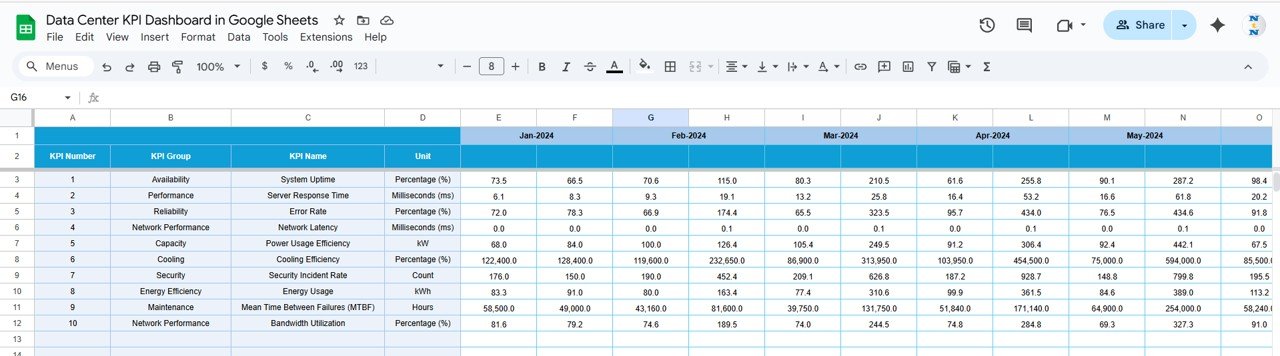
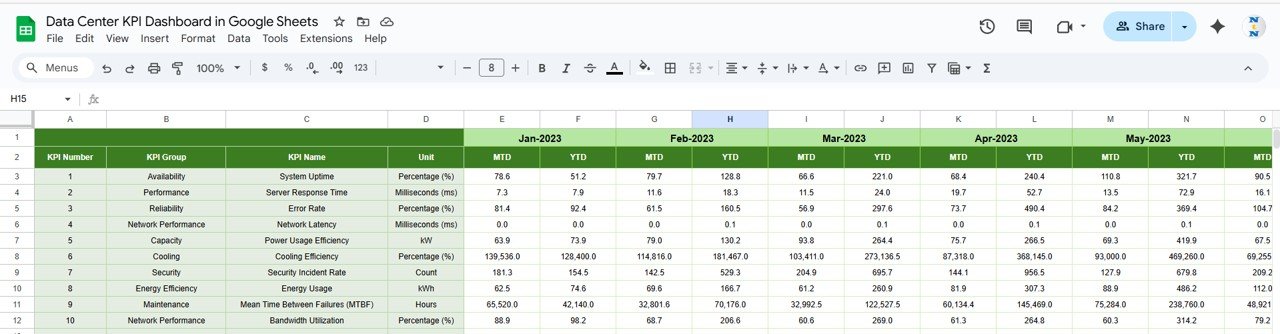
Previous Year Sheet Tab
Enter previous year’s MTD & YTD values for historical comparison.
KPI Definition Sheet Tab
Contains full KPI definitions, formulas, and types.

Click to Buy Data Center KPI Dashboard in Google Sheets
Advantages of Data Center KPI Dashboard
-
Real-time view of operational health
-
Helps optimize server, rack, and storage utilization
-
Reduces downtime and improves service reliability
-
Tracks energy efficiency using PUE and cooling metrics
-
Supports compliance and audit readiness
-
Helps in proactive maintenance and capacity planning
-
All KPIs are automated with MTD/YTD comparisons
Opportunities for Improvement
Click to Buy Data Center KPI Dashboard in Google Sheets
You can enhance this dashboard by adding:
-
Real-time integration with monitoring tools (optional)
-
Incident severity classification
-
Region-based data center comparison
-
Forecasting capacity (CPU, storage, bandwidth)
-
Alerts for threshold or KPI breaches
-
Carbon footprint tracking for sustainability
Best Practices
-
Update actual data weekly or monthly
-
Maintain consistent KPI definitions
-
Review PUE and cooling KPIs regularly for cost savings
-
Monitor incident and downtime KPIs daily
-
Use conditional formatting to highlight critical issues
-
Compare YTD vs Previous Year to spot improvements
Conclusion
Click to Buy Data Center KPI Dashboard in Google Sheets
The Data Center KPI Dashboard in Google Sheets is an essential tool for managing uptime, efficiency, capacity, and cost in modern data centers. With automated KPI cards, MTD/YTD comparisons, trend charts, and a complete KPI definition sheet, it provides a powerful, cost-effective way to manage performance and reliability.
Visit our YouTube channel to learn step-by-step video tutorials
Youtube.com/@NeotechNavigators
Watch the step-by-step video Demo: