Managing debt effectively is crucial for maintaining financial stability. Whether you’re tracking personal debt or managing a corporate debt portfolio, having a comprehensive overview of key performance indicators (KPIs) can provide valuable insights into your financial health. The Debt Management KPI Dashboard in Google Sheets is a powerful tool designed to help you monitor and analyze your debt-related metrics, ensuring you stay on track with your financial goals.
In this article, we’ll walk you through the features of this dashboard, explain how it works, and show you how it can simplify your debt management process.
What is the Debt Management KPI Dashboard in Google Sheets?
The Debt Management KPI Dashboard in Google Sheets is a comprehensive template that helps track and monitor your debt performance. By providing a clear visual overview of key debt-related metrics, this dashboard allows you to make informed decisions and manage debt efficiently.
The dashboard consists of six essential worksheets that capture real-time data and help you compare it against your targets. These worksheets include data entry sections for actual values, targets, previous year data, and KPI definitions, making it easy to customize for your specific needs.
Key Features of the Debt Management KPI Dashboard
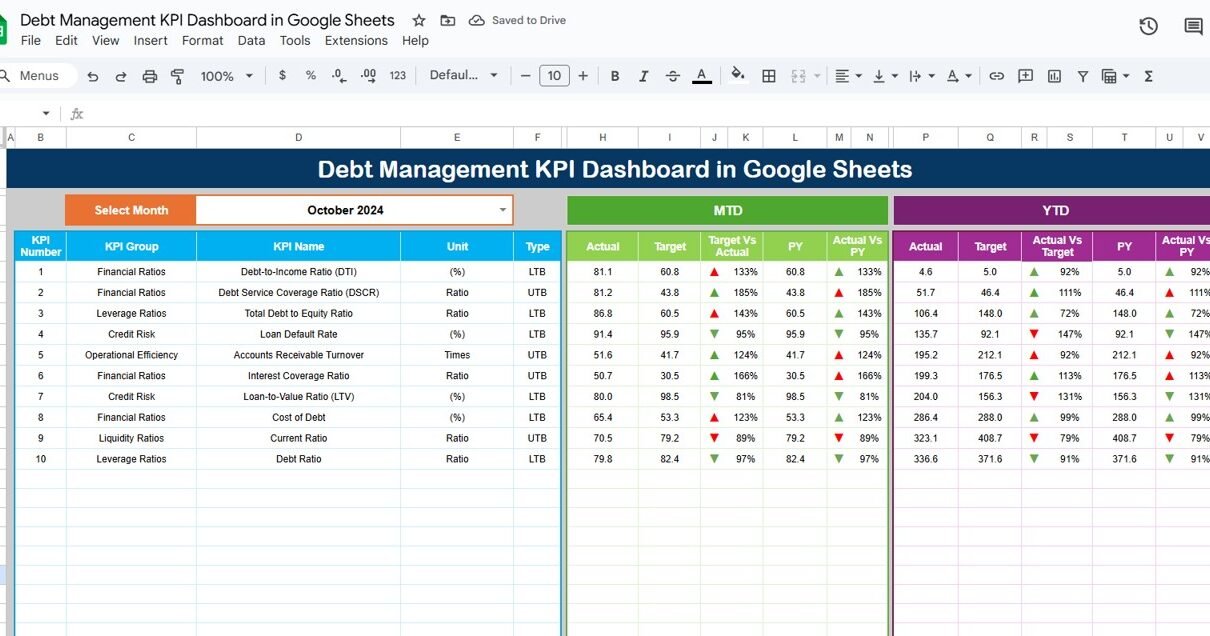
1) Dashboard Sheet Tab: The Main Overview
The Dashboard Sheet serves as the central hub where all KPI data is displayed. The dashboard includes the following features:
MTD (Month-To-Date) and YTD (Year-To-Date) Metrics:
- MTD Actual: Shows the actual debt figures for the current month.
- MTD Target: Displays the target figures for the current month.
- PY MTD: Compares the current MTD to the previous year’s MTD.
- Target vs Actual: A percentage comparison showing the difference between actual numbers and targets for MTD and YTD.
- PY vs Actual: A comparison of current year data to previous year data for both MTD and YTD.
-
Conditional Formatting: The dashboard uses arrows (▲/▼) to visually represent whether the data is above or below the target.

Click to buy Debt Management KPI Dashboard in Google Sheets
2) KPI Trend Sheet Tab: Detailed KPI Trends
The KPI Trend Sheet allows you to dive deeper into individual KPIs. In this sheet, you can select a specific KPI from a dropdown list (range C3), and the following information will be displayed:
-
KPI Group: The category or group the KPI falls under.
-
Unit: The unit of measurement for the KPI (e.g., dollars, percentage).
-
KPI Type: Indicates whether the KPI is Lower the Better (LTB) or Upper the Better (UTB).
-
Formula: The formula used to calculate the KPI.
-
Definition: A brief description of what the KPI measures and how it’s calculated.

Click to buy Debt Management KPI Dashboard in Google Sheets
3) Actual Number Sheet Tab: Enter Real Data
The Actual Number Sheet is where you input the actual debt data for both MTD and YTD for a particular month. You can easily change the month by updating range E1 (input the first month of the year, and the data will adjust accordingly).

4) Target Sheet Tab: Set Your Debt Targets
In the Target Sheet, you will enter the target values for each KPI, both for MTD and YTD. This sheet allows you to define the financial goals for debt management, which are then compared to the actual data in the dashboard.

Click to buy Debt Management KPI Dashboard in Google Sheets
5) Previous Year Number Sheet Tab: Historical Comparison
The Previous Year Number Sheet lets you input data from the previous year. This allows for year-over-year comparisons and helps you track your progress in managing debt over time.

6) KPI Definition Sheet Tab: Clarify Each KPI
In the KPI Definition Sheet, you will enter details for each KPI, including:
-
KPI Name
-
KPI Group
-
Unit of Measurement
-
Formula
-
KPI Definition
This sheet helps provide clarity on what each KPI represents and how it’s measured.

Click to buy Debt Management KPI Dashboard in Google Sheets
Benefits of Using the Debt Management KPI Dashboard
Using the Debt Management KPI Dashboard offers several advantages for individuals or businesses managing debt:
-
Comprehensive Overview: The dashboard provides a clear and concise overview of your debt situation, helping you monitor multiple KPIs in one place.
-
Real-Time Monitoring: As you update the data in the Actual Number and Target Sheets, the dashboard automatically updates to reflect the latest information.
-
Customizable: You can tailor the KPIs, data ranges, and formulas to suit your specific debt management needs.
-
Historical Comparisons: By comparing current data with previous year figures, you can track improvements or identify areas that need attention.
-
Visual Insights: The use of arrows and charts helps visualize your progress towards targets, making it easy to identify whether you’re on track.
Best Practices for Using the Debt Management KPI Dashboard
To get the most out of your Debt Management KPI Dashboard, follow these best practices:
- Update Regularly: Keep the dashboard up to date by entering actual values and adjusting targets as needed.
- Set Realistic Targets: Set achievable targets for debt reduction and financial goals based on historical data and current trends.
- Monitor Key KPIs: Focus on the KPIs that are most important for managing your debt effectively, such as the debt-to-income ratio or monthly payment goals.
- Leverage Year-over-Year Comparisons: Use the historical data to track your progress and identify areas where you can improve.
- Collaborate with Your Financial Team: If you’re managing debt as part of a business, share the dashboard with your financial team for collaborative decision-making.
Conclusion
Click to buy Debt Management KPI Dashboard in Google Sheets
The Debt Management KPI Dashboard in Google Sheets is an essential tool for anyone looking to stay on top of their debt management. With clear, visual insights into key metrics such as MTD and YTD performance, historical comparisons, and progress tracking, this dashboard ensures that you can make informed decisions and maintain financial stability. Whether you’re managing personal debt or overseeing a company’s debt portfolio, this dashboard provides the tools needed to keep debt under control and meet your financial goals.
Frequently Asked Questions (FAQs)
1. What KPIs can I track using the Debt Management KPI Dashboard?
You can track a variety of debt-related KPIs, such as debt-to-income ratio, monthly debt payments, interest rates, and total outstanding debt.
2. How do I update the data in the dashboard?
Simply enter the actual debt data in the Actual Number Sheet, set your targets in the Target Sheet, and input historical data in the Previous Year Number Sheet.
3. Can I customize the KPIs in the dashboard?
Yes, the dashboard is fully customizable. You can add, remove, or adjust KPIs based on your specific debt management needs.
4. How often should I update the dashboard?
It’s recommended to update the dashboard monthly to ensure it reflects your most current financial situation and progress toward your debt goals.
5. Can I compare my debt data with the previous year?
Yes, the dashboard allows you to compare your current year’s data with the previous year’s data to track improvements or identify areas for improvement.
Visit our YouTube channel to learn step-by-step video tutorials
Youtube.com/@NeotechNavigators