Digital assets such as images, videos, documents, design files, marketing creatives, brand resources, and multimedia content play a critical role in modern organizations. As digital content volume grows, teams often struggle to manage access, usage, updates, storage efficiency, and compliance. Because of this, organizations need structured performance tracking for digital asset management.Digital Asset Management KPI Dashboard in Google Sheets
A Digital Asset Management KPI Dashboard in Google Sheets provides a clear and centralized way to measure asset usage, efficiency, compliance, storage optimization, and team productivity. It transforms raw asset data into meaningful KPIs with monthly and yearly insights. Moreover, because the dashboard runs in Google Sheets, teams collaborate easily without installing or maintaining expensive DAM software.
In this article, you will learn how this dashboard works, its worksheet structure, complete KPI list with formulas and definitions, advantages, improvement opportunities, best practices, and FAQs.Digital Asset Management KPI Dashboard in Google Sheets
What Is a Digital Asset Management KPI Dashboard in Google Sheets?
Click to Buy Digital Asset Management KPI Dashboard in Google Sheets
A Digital Asset Management (DAM) KPI Dashboard is a performance monitoring tool that tracks how digital assets are stored, accessed, reused, updated, and governed across an organization. It helps teams answer questions such as:
-
How many assets are actively used?
-
How often do teams reuse assets?
-
Are assets well-tagged and searchable?
-
Are storage costs optimized?
-
Are assets compliant with brand and licensing rules?
Instead of relying on assumptions or manual audits, this dashboard provides measurable insights through structured KPIs.
Because this solution uses Google Sheets, it offers:
- Real-time updates
- Automated calculations
- MTD & YTD comparison
- Easy customization
- Zero software dependency
Key Worksheet Structure of the Dashboard
The Digital Asset Management KPI Dashboard includes 6 structured worksheet tabs, each supporting a clear purpose.
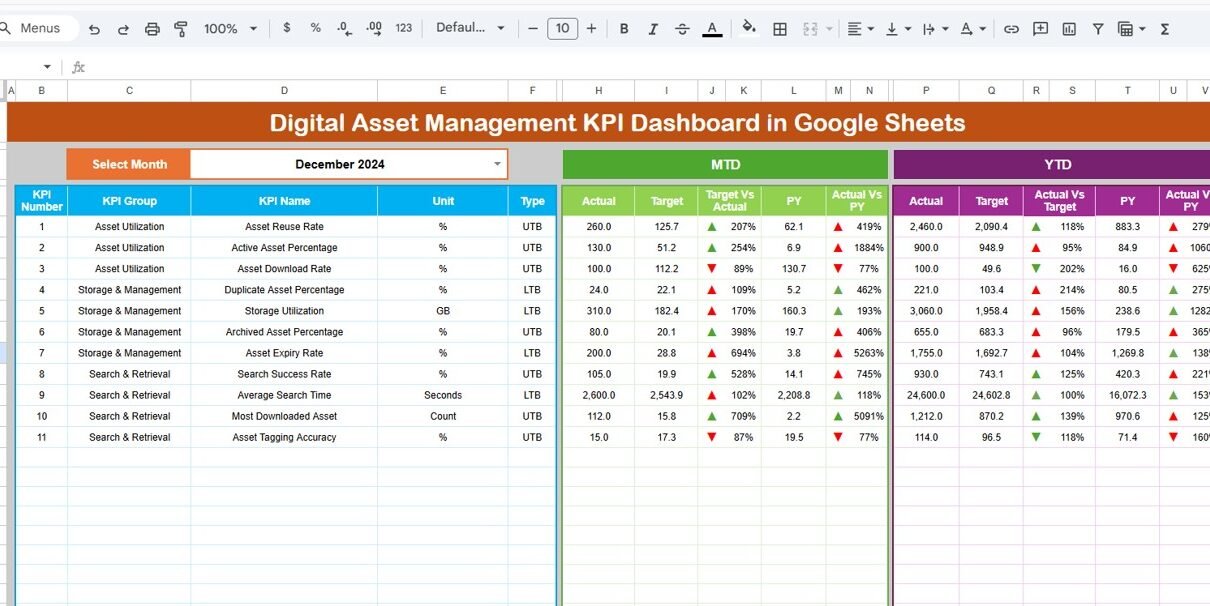
1. Dashboard Sheet Tab (Main Dashboard)
This is the executive overview page.
-
Select the month from the dropdown in cell D3
-
All KPIs update automatically for that month
MTD Metrics
-
MTD Actual
-
MTD Target
-
MTD Previous Year
-
Target vs Actual
-
Previous Year vs Actual
YTD Metrics
-
YTD Actual
-
YTD Target
-
YTD Previous Year
-
Target vs Actual
-
Previous Year vs Actual
Conditional formatting with up/down arrows highlights performance trends clearly for leadership reviews.

Click to Buy Digital Asset Management KPI Dashboard in Google Sheets
2. KPI Trend Sheet Tab
This sheet helps users analyze individual KPIs in detail.
-
Select the KPI name from the dropdown in cell C3
The sheet displays:
-
KPI Group
-
KPI Unit
-
KPI Type (Lower the Better / Upper the Better)
-
KPI Formula
-
KPI Definition
It also shows month-wise trend charts, helping teams identify improvement patterns or efficiency gaps.

3. Actual Number Sheet Tab
This sheet captures real performance values.
-
Enter MTD Actual and YTD Actual
-
Select the first month of the year in cell E1
All dashboard values refresh automatically after data entry.

Click to Buy Digital Asset Management KPI Dashboard in Google Sheets
4. Target Sheet Tab
This sheet contains performance benchmarks.
- Monthly (MTD) target
- Annual (YTD) target
Targets help teams align DAM performance with business objectives.

5. Previous Year Number Sheet Tab
This sheet stores last year’s DAM KPIs.
It supports:
- Year-over-year analysis
- Optimization tracking
- Maturity measurement

Click to Buy Digital Asset Management KPI Dashboard in Google Sheets
6. KPI Definition Sheet Tab
This governance sheet ensures clarity and consistency.
It contains:
- KPI Name
- KPI Group
- Unit
- Formula
- Definition
- KPI Type (LTB / UTB)

Click to Buy Digital Asset Management KPI Dashboard in Google Sheets
Advantages of the Digital Asset Management KPI Dashboard
-
Centralized DAM performance visibility
-
Faster asset discovery
-
Improved content reuse
-
Reduced storage waste
-
Better compliance tracking
-
Optimized creative workflows
-
Easy collaboration in Google Sheets
Opportunities for Improvement in DAM Tracking
-
Integrate cloud storage platforms
-
Add asset type-wise KPIs
-
Track creative turnaround time
-
Enable alert-based governance
-
Introduce AI-driven tagging metrics
Best Practices for Using the DAM KPI Dashboard
Click to Buy Digital Asset Management KPI Dashboard in Google Sheets
-
Update usage metrics regularly
-
Enforce metadata standards
-
Monitor duplication and expiry
-
Review trends monthly
-
Align KPIs with marketing goals
-
Maintain KPI definitions clearly
Conclusion
The Digital Asset Management KPI Dashboard in Google Sheets helps organizations gain control over digital content, improve reuse, reduce operational inefficiencies, and ensure compliance. It converts asset activity into actionable insights while remaining simple, flexible, and collaborative. With structured KPIs and trend analysis, teams manage digital assets strategically instead of reactively.
Frequently Asked Questions (FAQs)
Click to Buy Digital Asset Management KPI Dashboard in Google Sheets
1. Who should use this dashboard?
Marketing, creative, brand, IT, and operations teams.
2. Can KPIs be customized?
Yes, all KPIs can be modified easily.
3. Does it support MTD and YTD reporting?
Yes, both are included.
4. Is Google Sheets suitable for DAM tracking?
Yes, with proper access controls.
5. Can automation be added later?
Yes, using Google Apps Script or APIs.
Visit our YouTube channel to learn step-by-step video tutorials
Youtube.com/@NeotechNavigators
Watch the step-by-step video tutorial:
Click to Buy Digital Asset Management KPI Dashboard in Google Sheets