In the ever-evolving world of distribution, maintaining an efficient system is crucial for meeting customer expectations and optimizing performance. One of the best ways to manage and evaluate distribution processes is through a Distribution KPI Dashboard in Google Sheets. This powerful tool helps monitor key metrics that directly impact business operations, enabling stakeholders to make data-driven decisions for process improvement.
This article will explore the features of the Distribution KPI Dashboard in Google Sheets, dive into the key performance indicators (KPIs) used, and explain how they can be leveraged to track and optimize distribution operations.
What is a Distribution KPI Dashboard?
A Distribution KPI Dashboard is a visual tool that tracks the performance of various distribution-related metrics. By using Google Sheets, businesses can update and share this data in real-time, allowing managers and teams to evaluate performance against set targets. The dashboard typically includes data related to delivery efficiency, cost management, order accuracy, and customer satisfaction.
Key Features of the Distribution KPI Dashboard in Google Sheets
The Distribution KPI Dashboard in Google Sheets is a ready-to-use template designed to help you track essential distribution KPIs. It is organized into six main worksheets, each serving a specific function to ensure smooth and efficient tracking of your distribution performance.
1. Dashboard Sheet Tab
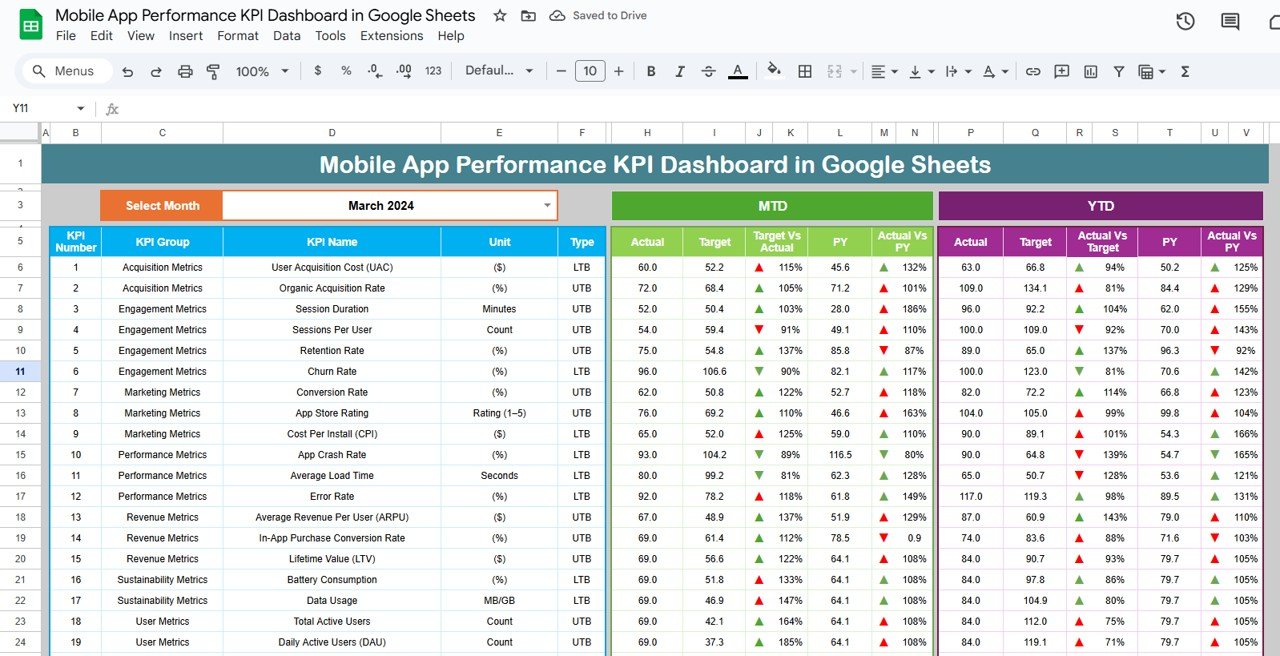
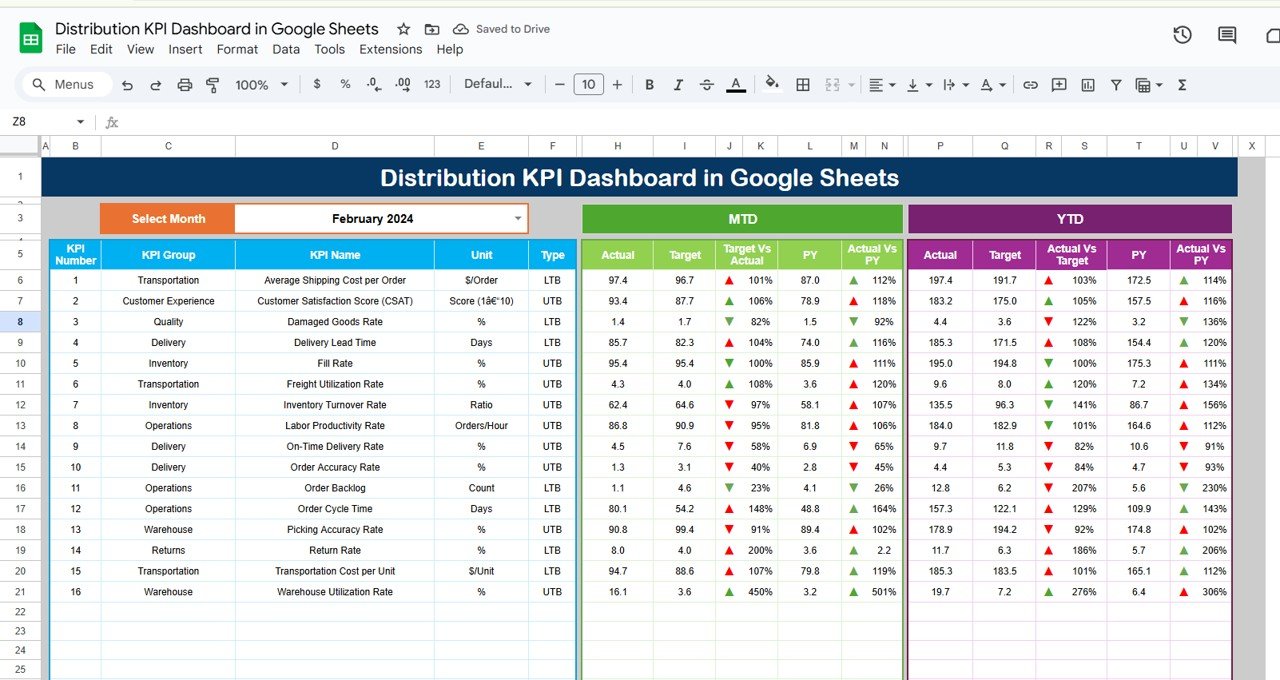
The Dashboard Sheet Tab is the central component of the dashboard where you can view key distribution metrics:
-
Month Selection: Select the month from a dropdown menu (D3) to update the dashboard and see the data for the chosen period.
-
KPIs Display: It showcases both Month-to-Date (MTD) and Year-to-Date (YTD) data, including a comparison between actual performance and Previous Year (PY) data.
-
Conditional Formatting: The dashboard uses up and down arrows to visually highlight whether the performance is improving or declining.
Click to buy Distribution KPI Dashboard in Google Sheets
2. KPI Trend Sheet Tab
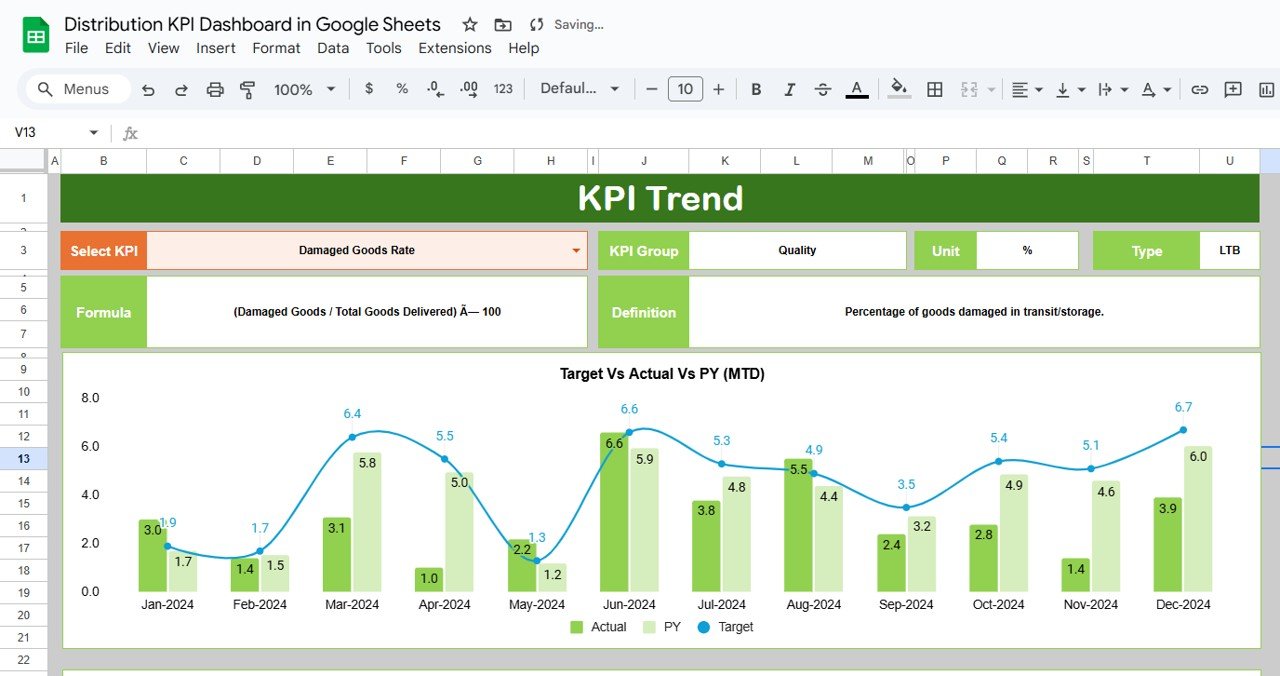
The KPI Trend Sheet Tab allows you to select any KPI from a dropdown menu in range C3. This sheet presents the following:
-
KPI Group: Organizes KPIs into categories (e.g., Cost, Efficiency, Customer Satisfaction).
-
Unit of KPI: Displays the unit of measurement for each KPI (e.g., units, cost per delivery, delivery time).
-
KPI Type: Indicates whether the KPI is “Lower the Better” (LTB) or “Upper the Better” (UTB).
-
Formula: Shows the formula used to calculate each KPI, giving transparency to the calculations.
-
Definition: A brief explanation of what each KPI tracks.
Click to buy Distribution KPI Dashboard in Google Sheets
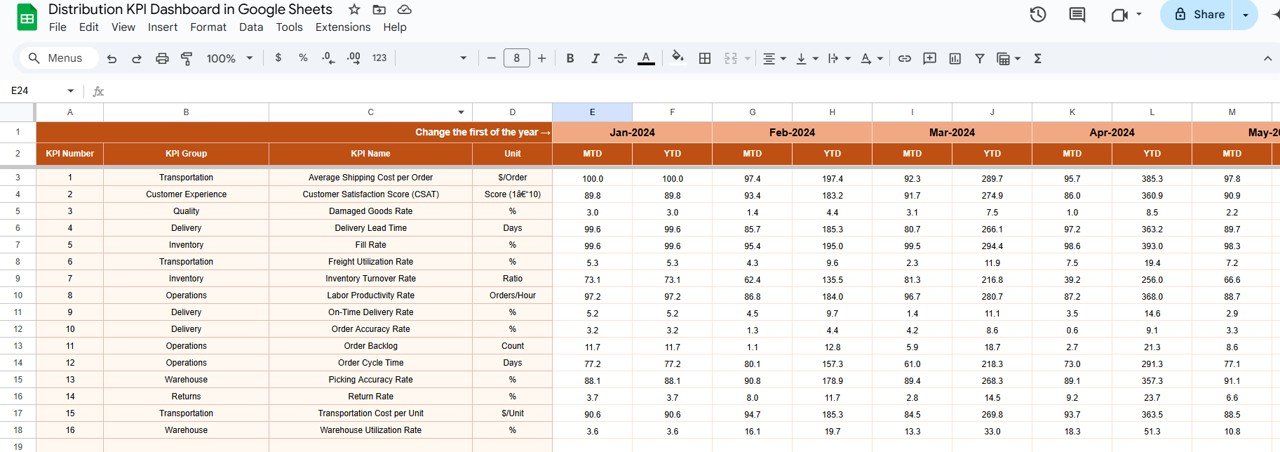
3. Actual Number Sheet Tab
In the Actual Number Sheet Tab, you input the actual data for MTD and YTD based on the selected month. The sheet dynamically updates depending on the first month of the year you enter in range E1.
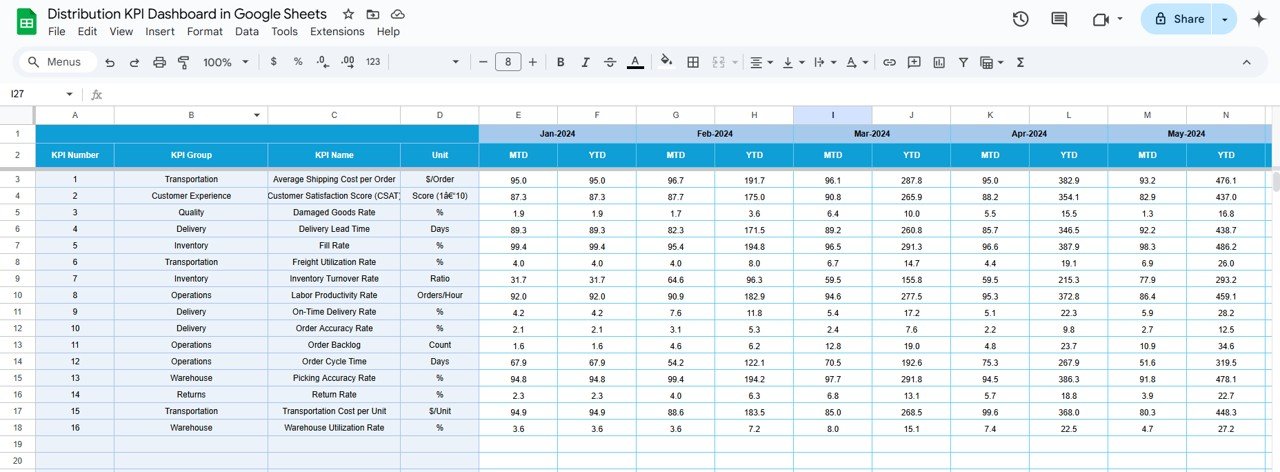
4. Target Sheet Tab
The Target Sheet Tab is used to enter the target numbers for each KPI, both for MTD and YTD. By entering target values, you can measure actual performance against expectations.’
Click to buy Distribution KPI Dashboard in Google Sheets
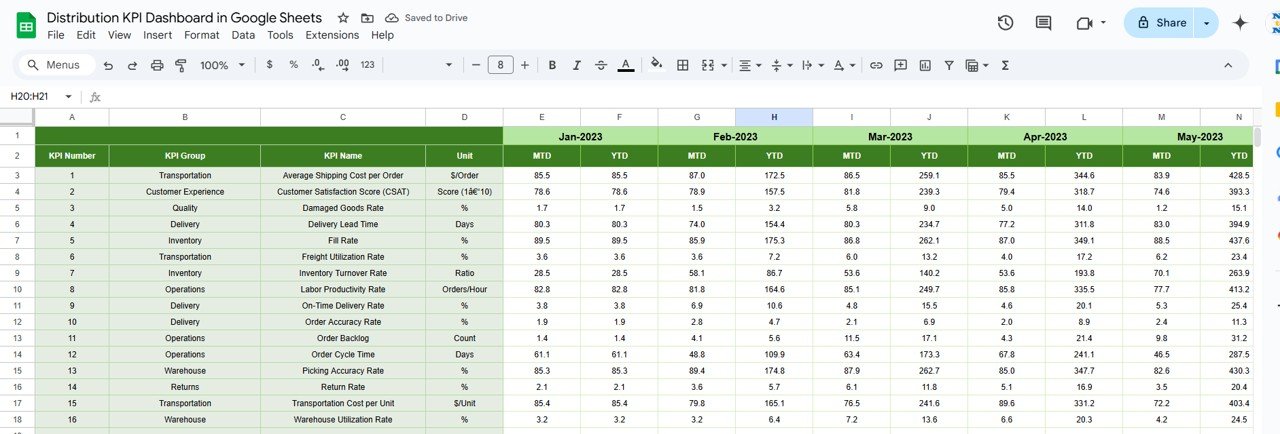
5. Previous Year Number Sheet Tab
The Previous Year Number Sheet Tab allows you to input the performance data from the previous year. This comparison helps identify trends, improvements, or areas that need attention.
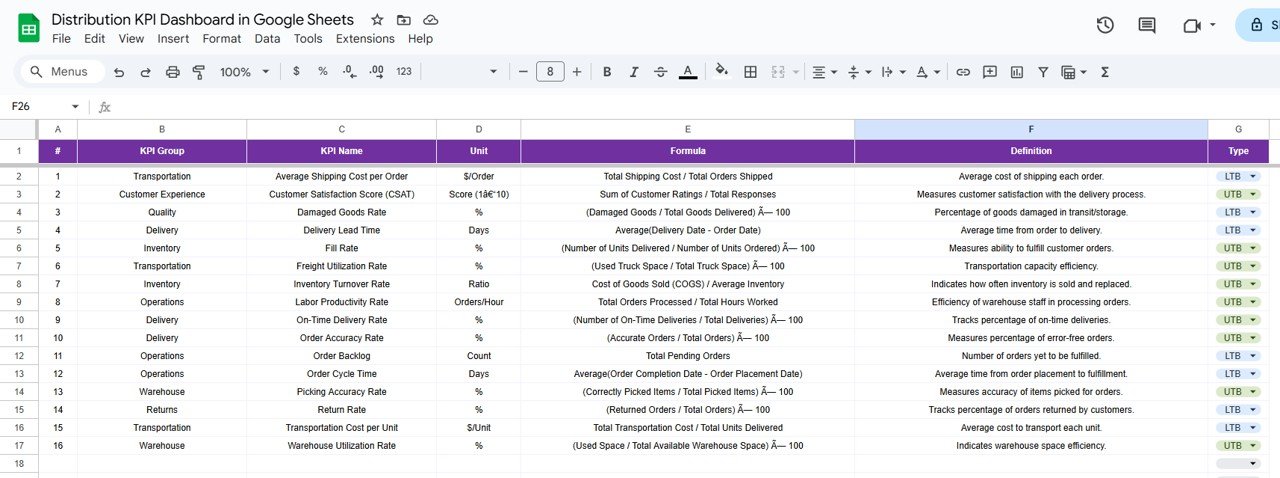
6. KPI Definition Sheet Tab
The KPI Definition Sheet Tab provides a detailed definition of each KPI, including:
-
KPI Name
-
KPI Group
-
Unit
-
Formula
-
Definition: A short explanation of what the KPI measures and its significance in distribution management.
Click to buy Distribution KPI Dashboard in Google Sheets
Advantages of Using a Distribution KPI Dashboard
A Distribution KPI Dashboard is a powerful tool for warehouse and distribution managers. Here are some of the key advantages of using this dashboard:
-
Real-Time Data Access: With Google Sheets, your team can access up-to-date information instantly, ensuring all stakeholders are working with the latest data.
-
Improved Decision Making: By tracking key metrics such as delivery time and order accuracy, you can make data-driven decisions to improve distribution efficiency.
-
Increased Efficiency: The dashboard helps identify bottlenecks and inefficiencies, allowing for targeted interventions that can streamline operations.
-
Cost Control: Tracking KPIs like cost per delivery and inventory turnover helps businesses manage expenses effectively.
-
Customer Satisfaction: By monitoring order accuracy and customer feedback, businesses can ensure high service levels, leading to increased customer satisfaction.
Opportunities for Improvement in Distribution KPIs
While the Distribution KPI Dashboard provides valuable insights, there are always opportunities for improvement:
-
Regular Review of KPIs: Businesses should periodically review the KPIs to ensure they remain relevant as the company grows and the market changes.
-
Incorporating New Metrics: As distribution evolves, businesses can consider adding new KPIs, such as environmental impact or supply chain sustainability metrics.
-
Automating Data Entry: Use Google Sheets integrations or scripts to automate data entry from other systems, reducing the risk of errors and saving time.
-
Employee Training: Provide training to distribution teams on how to understand and act on KPIs to improve overall warehouse performance.
Best Practices for Using the Distribution KPI Dashboard
Click to buy Distribution KPI Dashboard in Google Sheets
To get the most out of the Distribution KPI Dashboard, follow these best practices:
-
Set Clear Targets: Define realistic and achievable targets for each KPI to ensure performance is measured against meaningful benchmarks.
-
Update Data Regularly: Ensure that the data in the dashboard is updated regularly to reflect the most current performance.
-
Use Conditional Formatting: Take full advantage of the conditional formatting features to visually highlight areas needing attention.
-
Track Long-Term Trends: Use historical data from previous years to identify long-term trends and opportunities for continuous improvement.
-
Ensure Data Accuracy: Ensure that the data entered into the dashboard is accurate and reliable to avoid misleading insights.
Conclusion
The Distribution KPI Dashboard in Google Sheets is an invaluable tool for managing and improving distribution performance. It allows businesses to track essential KPIs in real-time, providing insights into key metrics like on-time delivery, cost per delivery, order accuracy, and more. By leveraging this dashboard, businesses can optimize their distribution operations, reduce costs, and ultimately enhance customer satisfaction.
Frequently Asked Questions (FAQ)
Click to buy Distribution KPI Dashboard in Google Sheets
1. What KPIs should I include in my Distribution KPI Dashboard?
Essential KPIs for distribution include On-Time Delivery, Cost per Delivery, Order Accuracy, Delivery Time, Inventory Turnover, and Customer Satisfaction.
2. Can I customize the Distribution KPI Dashboard for my specific business?
Yes, the template is fully customizable. You can add or remove KPIs based on your business needs.
3. How often should I update the data in the Distribution KPI Dashboard?
It’s best to update the data at least weekly or daily, depending on your business operations.
4. How do I calculate the KPIs in the dashboard?
Each KPI has a predefined formula in the KPI Trend Sheet Tab. You simply need to enter the relevant data into the Actual Number Sheet and Target Sheet.
5. Can the Distribution KPI Dashboard integrate with other systems?
Yes, you can integrate the dashboard with other systems using Google Sheets’ API or Google Apps Script to automate data input.
Visit our YouTube channel to learn step-by-step video tutorials
Youtube.com/@NeotechNavigators
Watch the step-by-step video Demo: