Diversity and inclusion (D&I) are key pillars of a thriving workplace, ensuring a fair and inclusive environment for all employees. The Diversity and Inclusion KPI Dashboard in Google Sheets is a powerful tool designed to help organizations track and measure the success of their D&I efforts. By monitoring key performance indicators (KPIs), organizations can gain insights into their progress, identify areas for improvement, and make data-driven decisions to enhance diversity and inclusion.Diversity and Inclusion KPI Dashboard in Google Sheets
In this article, we will explore the key features of the Diversity and Inclusion KPI Dashboard, how it works, and how it can benefit your organization’s D&I initiatives.Diversity and Inclusion KPI Dashboard in Google Sheets
What is the Diversity and Inclusion KPI Dashboard in Google Sheets?
The Diversity and Inclusion KPI Dashboard in Google Sheets is a ready-to-use template designed to track and analyze various metrics related to diversity and inclusion in the workplace. This dashboard helps you monitor key metrics such as gender diversity, ethnic diversity, employee satisfaction, and inclusivity, enabling you to make informed decisions and improve organizational performance.
The dashboard consists of six key worksheets that provide a comprehensive view of D&I performance across your organization.
Key Features of the Diversity and Inclusion KPI Dashboard
1) Dashboard Sheet Tab: The Main Overview
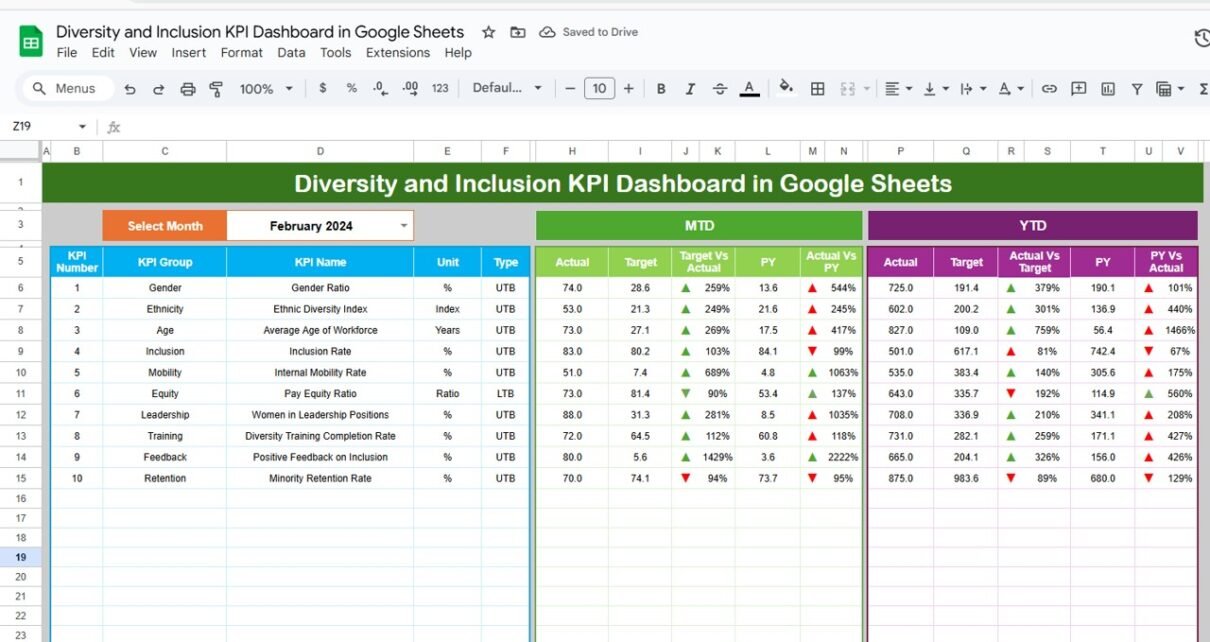
The Dashboard Sheet Tab serves as the main interface for the Diversity and Inclusion KPI Dashboard, providing a high-level overview of all KPIs. The dashboard includes the following elements:
MTD (Month-to-Date) and YTD (Year-to-Date) Metrics:
- MTD Actual: Displays the actual data for the selected month.
- MTD Target: Shows the target values for the selected month.
- PY MTD: Compares the current MTD values with the previous year’s MTD values.
- Target vs Actual (MTD & YTD): Compares actual numbers with targets for both MTD and YTD, with conditional formatting that uses up and down arrows to indicate whether targets have been met.
- PY vs Actual (MTD & YTD): Compares current data with previous year data, giving you a clear view of year-over-year performance.
These metrics help you quickly assess your organization’s performance in diversity and inclusion initiatives.

Click to buy Diversity and Inclusion KPI Dashboard in Google Sheets
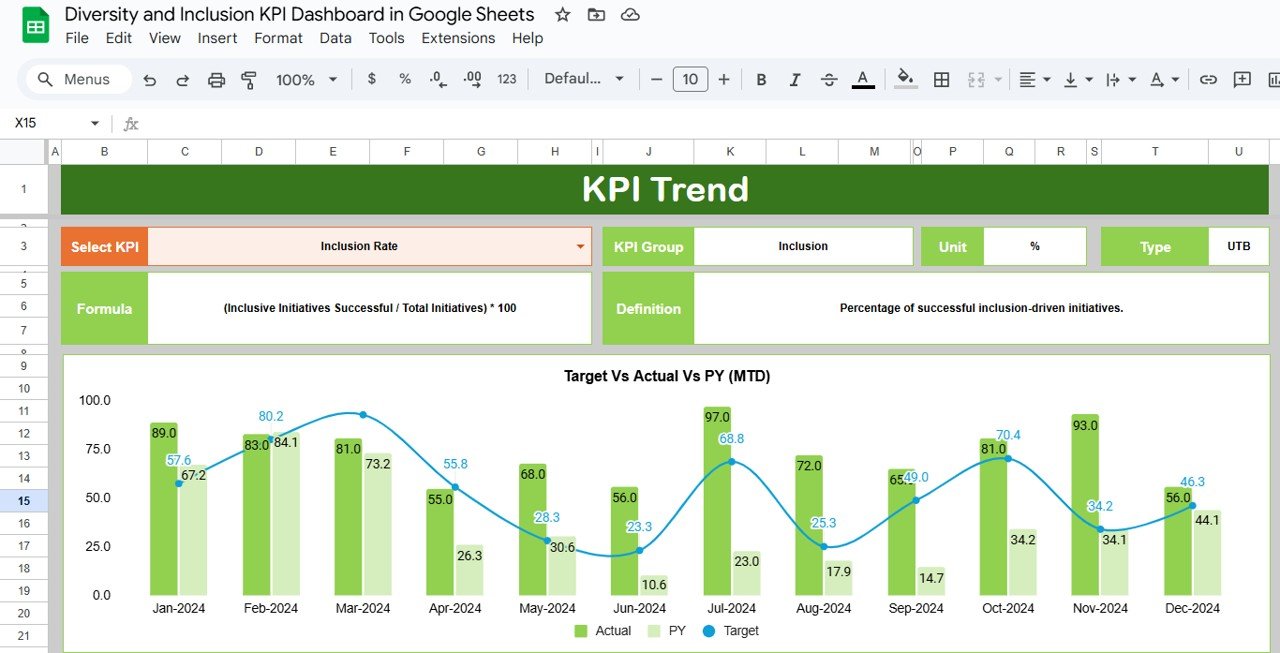
2) KPI Trend Sheet Tab: Detailed KPI Insights
The KPI Trend Sheet provides in-depth analysis of individual KPIs. You can select a specific KPI from a dropdown list (range C3), and the following details will be displayed:
-
KPI Group: The category or group the KPI belongs to (e.g., gender, ethnicity, inclusion).
-
Unit: The unit of measurement for the KPI (e.g., percentage, number).
-
KPI Type: Whether the KPI is Lower the Better (LTB) or Upper the Better (UTB).
-
Formula: The formula used to calculate the KPI.
-
Definition: A brief description of the KPI and what it measures.
This sheet allows you to understand each KPI in detail, helping you track progress and identify areas that need attention.
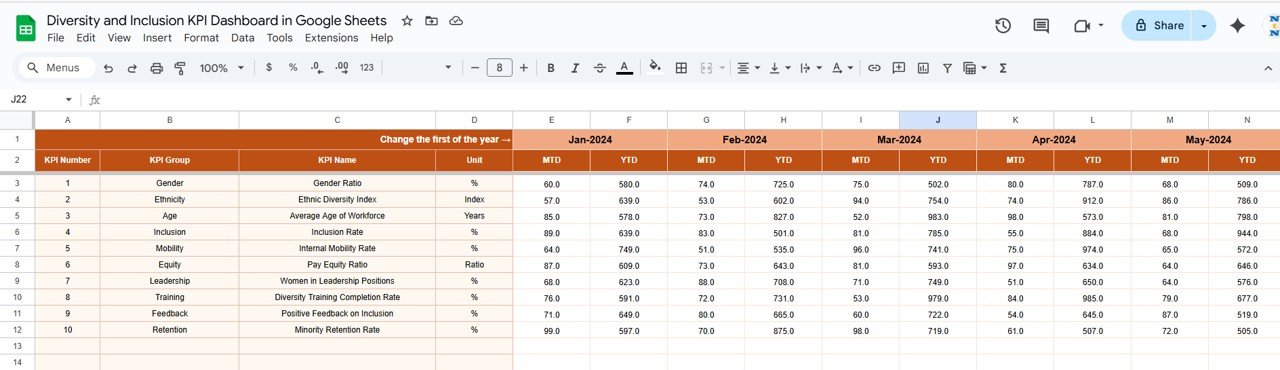
3) Actual Number Sheet Tab: Enter Real Data
The Actual Number Sheet is where you input the actual values for both MTD and YTD for a specific month. You can easily change the month by updating the Start Month in range E1. Once the month is selected, the data in the dashboard will adjust accordingly. This sheet allows you to track actual D&I performance in real-time.
Click to buy Diversity and Inclusion KPI Dashboard in Google Sheets
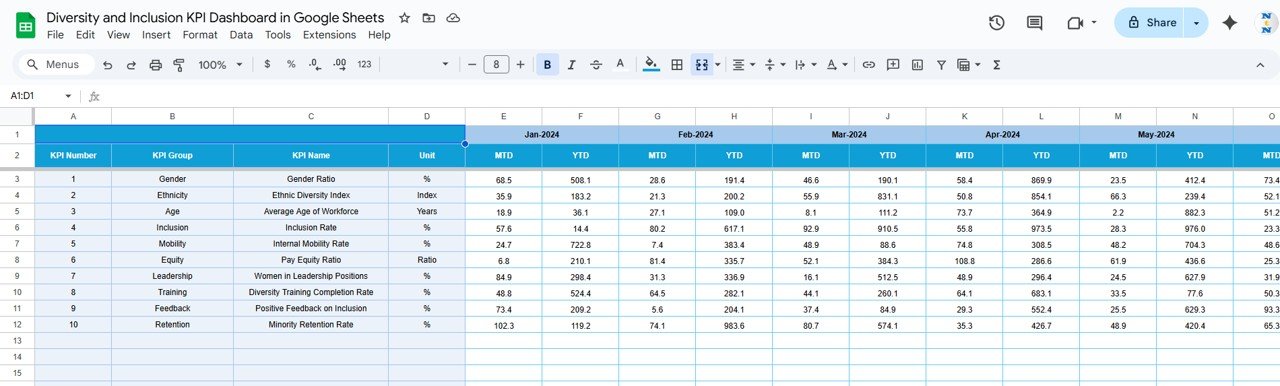
4) Target Sheet Tab: Set Your D&I Targets
In the Target Sheet, you can set the target values for each KPI, both for MTD and YTD. These targets are benchmarks for the D&I initiatives, helping you track whether you’re meeting your diversity and inclusion goals.
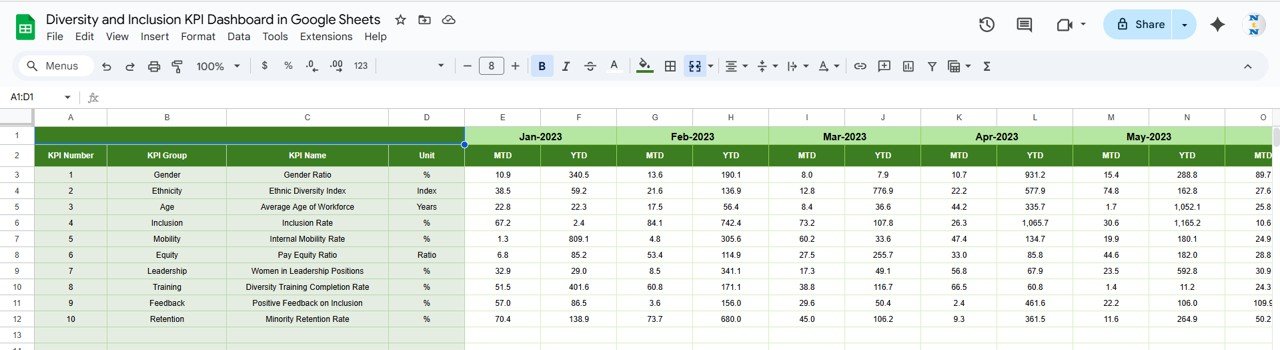
5) Previous Year Number Sheet Tab: Historical Comparison
The Previous Year Number Sheet allows you to input data from the previous year. This provides a year-over-year comparison, enabling you to track improvements or declines in your diversity and inclusion performance.
Click to buy Diversity and Inclusion KPI Dashboard in Google Sheets
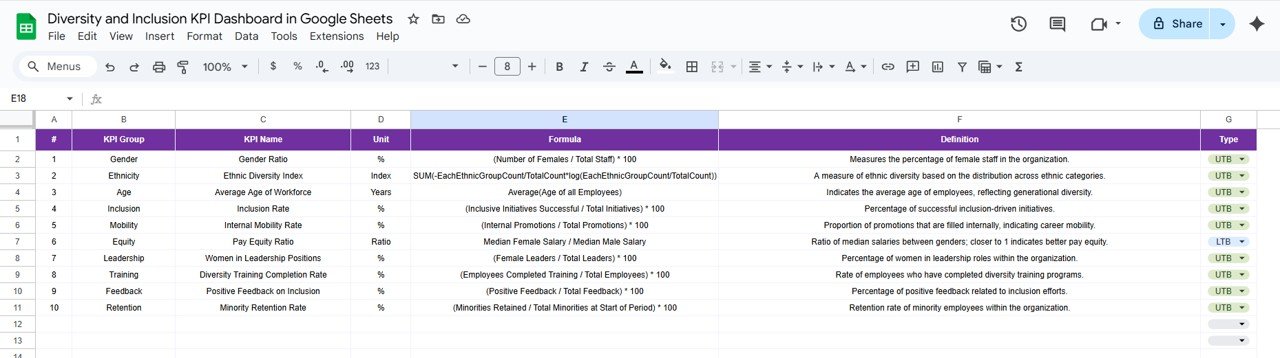
6) KPI Definition Sheet Tab: Define Each KPI
The KPI Definition Sheet provides clarity on each KPI by listing:
-
KPI Name
-
KPI Group
-
Unit of Measurement
-
Formula
-
KPI Definition
This sheet ensures that every KPI is clearly defined, helping you track and measure D&I efforts accurately.
Benefits of Using the Diversity and Inclusion KPI Dashboard
Click to buy Diversity and Inclusion KPI Dashboard in Google Sheets
The Diversity and Inclusion KPI Dashboard offers several benefits for organizations committed to enhancing diversity and inclusion:
-
Comprehensive Overview: Provides a clear snapshot of key D&I metrics, allowing you to track progress and performance at a glance.
-
Data-Driven Decision Making: The dashboard helps you make informed decisions by providing insights into areas such as gender diversity, ethnic diversity, and employee satisfaction.
-
Real-Time Tracking: As you enter new data, the dashboard automatically updates with the latest information, providing real-time insights.
-
Year-over-Year Comparison: By comparing current data with previous years, the dashboard helps you assess long-term progress and identify areas for improvement.
-
Customizable: The dashboard is fully customizable to meet the specific needs of your organization. You can add, modify, or remove KPIs based on your D&I goals.
Best Practices for Using the Diversity and Inclusion KPI Dashboard
Click to buy Diversity and Inclusion KPI Dashboard in Google Sheets
To get the most out of the Diversity and Inclusion KPI Dashboard, follow these best practices:
-
Update Data Regularly: Keep the dashboard updated with the latest D&I data to ensure real-time insights and decision-making.
-
Set Realistic Targets: Set achievable targets for each KPI based on past performance and current trends.
-
Monitor Key KPIs: Focus on the most important KPIs for your organization, such as gender diversity, ethnic representation, and employee engagement.
-
Leverage Year-over-Year Comparisons: Regularly compare current performance with previous years to assess long-term progress and make necessary adjustments.
-
Collaborate with Your Team: Share the dashboard with HR, management, and leadership teams to ensure everyone is aligned with D&I goals.
Conclusion
The Diversity and Inclusion KPI Dashboard in Google Sheets is an invaluable tool for tracking and optimizing your organization’s diversity and inclusion efforts. By providing clear data, visual insights, and real-time tracking, this dashboard helps you monitor key D&I metrics and make informed decisions. Whether you’re tracking gender diversity, ethnic diversity, or employee satisfaction, this tool gives you the information you need to drive meaningful change and foster an inclusive work environment.
Frequently Asked Questions (FAQs)
Click to buy Diversity and Inclusion KPI Dashboard in Google Sheets
1. What KPIs can I track using the Diversity and Inclusion KPI Dashboard?
You can track a variety of KPIs, such as gender diversity, ethnic representation, employee satisfaction, hiring diversity, and more.
2. How often should I update the Diversity and Inclusion KPI Dashboard?
It’s recommended to update the dashboard monthly or quarterly, depending on how often you collect new D&I data.
3. Can I customize the KPIs in the dashboard?
Yes, the dashboard is fully customizable. You can modify existing KPIs, add new ones, or remove irrelevant ones based on your organization’s D&I goals.
4. How does the dashboard help improve D&I efforts?
The dashboard helps identify areas of improvement by tracking key D&I metrics. By comparing current performance with historical data, you can make data-driven decisions to enhance your diversity and inclusion efforts.
5. Can I share the Diversity and Inclusion KPI Dashboard with my team?
Yes, since it’s built in Google Sheets, you can easily share the dashboard with your team and collaborate in real time.
Visit our YouTube channel to learn step-by-step video tutorials
Youtube.com/@NeotechNavigators
Watch the step-by-step video Demo:
Click to buy Diversity and Inclusion KPI Dashboard in Google Sheets