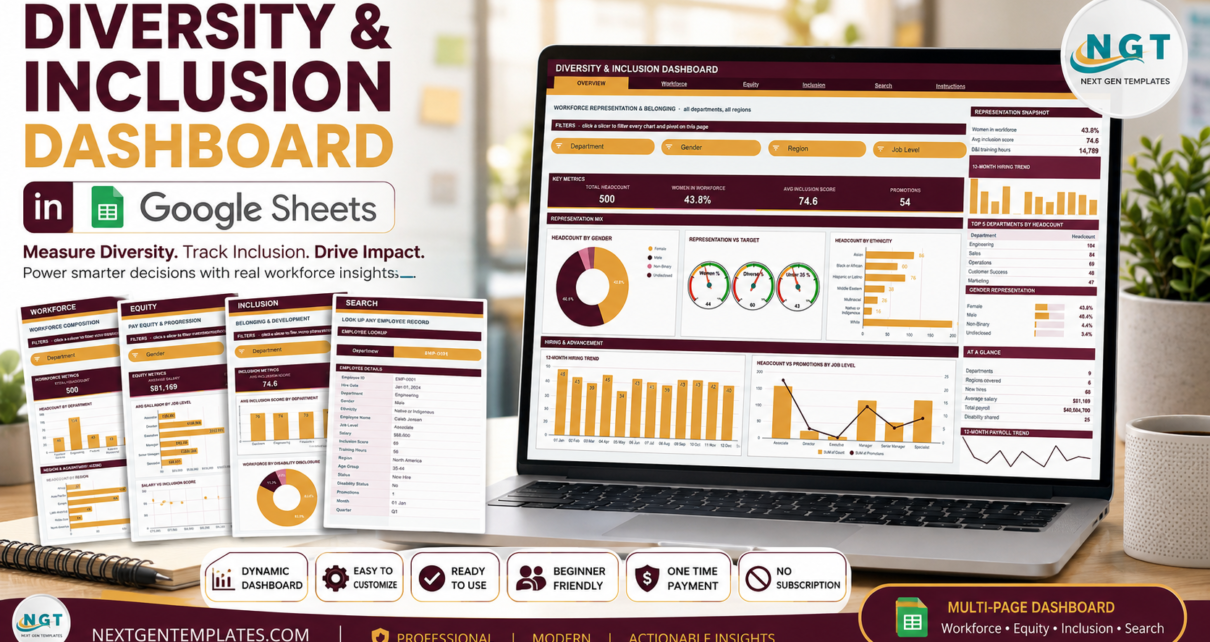
A six-tab Google Sheets workbook that charts workforce representation, pay and inclusion-survey scores from 500 sample employee records using native pivot tables and 16 slicers. A reporting tool only – it charts what you enter and gives no HR or legal advice.
Tag: inclusion metrics
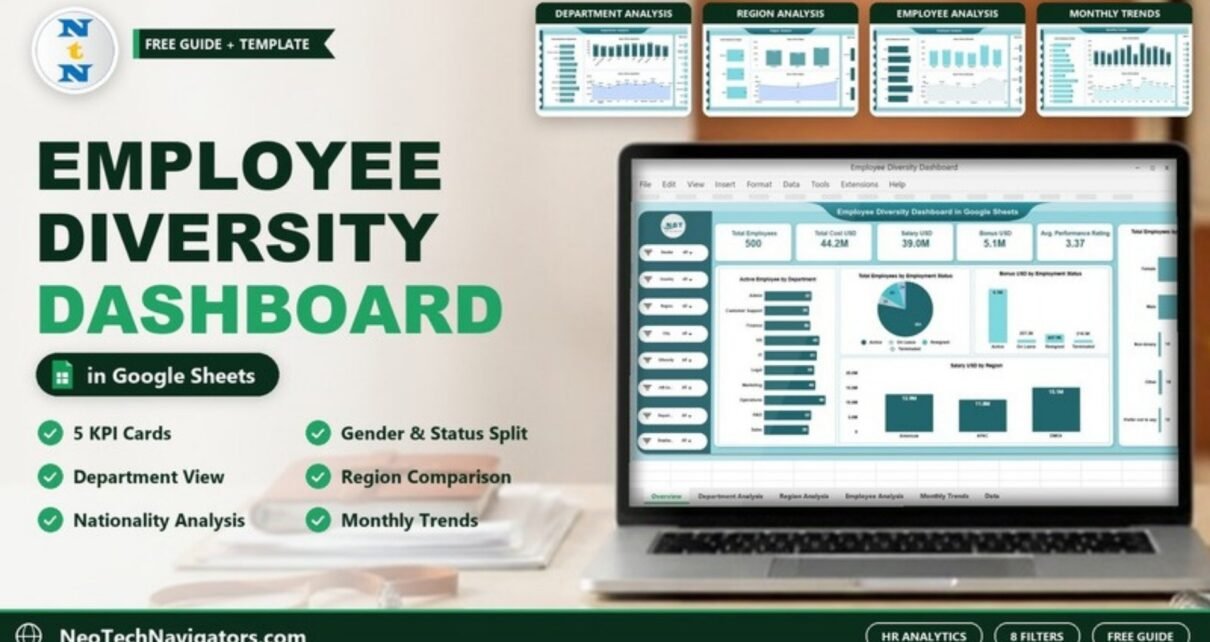
Employee Diversity Dashboard in Google Sheets
Workforce diversity plays a vital role in building inclusive, innovative, and high-performing organizations. However, many companies still track diversity data across multiple HR files, which makes analysis difficult and time-consuming. As a result, leaders fail to gain a clear picture of workforce composition and related costs.Employee Diversity Dashboard in Google Sheets That is exactly why […]
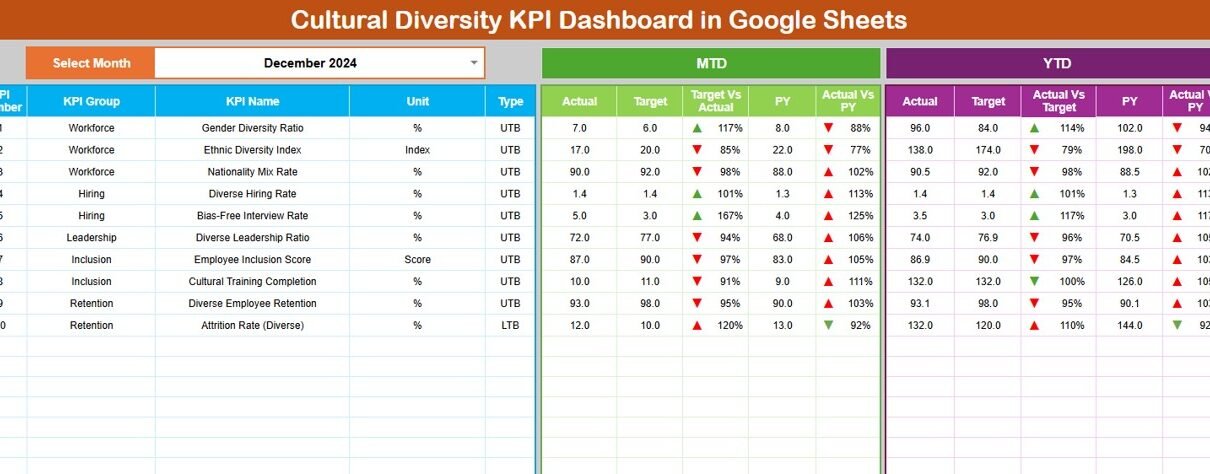
Cultural Diversity KPI Dashboard in Google Sheets
Cultural diversity has become a critical success factor for modern organizations. Diverse teams bring better ideas, stronger collaboration, and improved business performance. However, organizations cannot improve diversity unless they measure it clearly and consistently. When diversity data remains scattered across HR systems or static reports, decision-making becomes slow and ineffective.Cultural Diversity KPI Dashboard in Google […]
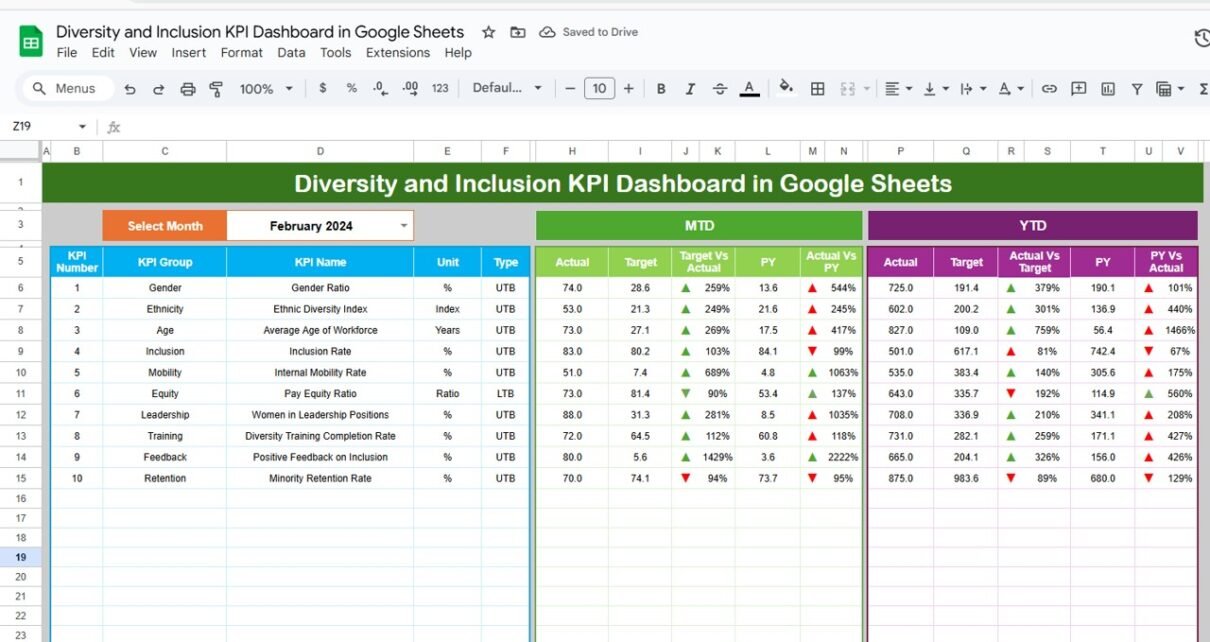
Diversity and Inclusion KPI Dashboard in Google Sheets
Diversity and inclusion (D&I) are key pillars of a thriving workplace, ensuring a fair and inclusive environment for all employees. The Diversity and Inclusion KPI Dashboard in Google Sheets is a powerful tool designed to help organizations track and measure the success of their D&I efforts. By monitoring key performance indicators (KPIs), organizations can gain […]