Employee retention is one of the strongest indicators of organizational health. When retention is high, productivity increases, hiring costs drop, and team morale stays strong. However, tracking retention manually becomes difficult as companies grow.Employee Retention KPI Dashboard in Google Sheets
The Employee Retention KPI Dashboard in Google Sheets solves this problem by providing a structured, ready-to-use solution to monitor employee retention metrics, turnover trends, manager performance, engagement levels, and workforce stability.Employee Retention KPI Dashboard in Google Sheets
In this article, you will learn the full structure of the dashboard along with a complete KPI list that includes units, formulas, definitions, and KPI types (Upper the Better / Lower the Better).Employee Retention KPI Dashboard in Google Sheets
What Is the Employee Retention KPI Dashboard in Google Sheets?
This dashboard is designed to help HR teams, managers, and leadership understand workforce behavior. It tracks:
-
Retention rates
-
Turnover trends
-
Tenure patterns
-
Engagement scores
-
Manager-wise & department-wise performance
-
Employee stability indicators
With MTD/YTD performance, Target vs Actual, and PY vs Actual, it becomes a complete HR analytics solution.
Why Use Google Sheets for Employee Retention KPIs?
Click to Buy Employee Retention KPI Dashboard in Google Sheets
Google Sheets is:
-
Cloud-based
-
Easy to update
-
Real-time collaborative
-
Fully customizable
-
Perfect for HR teams working remotely or across locations
It requires no technical skills and updates instantly as new employee data is added.
Dashboard Structure and Worksheets
The dashboard contains 6 main sheets, each serving an important function.
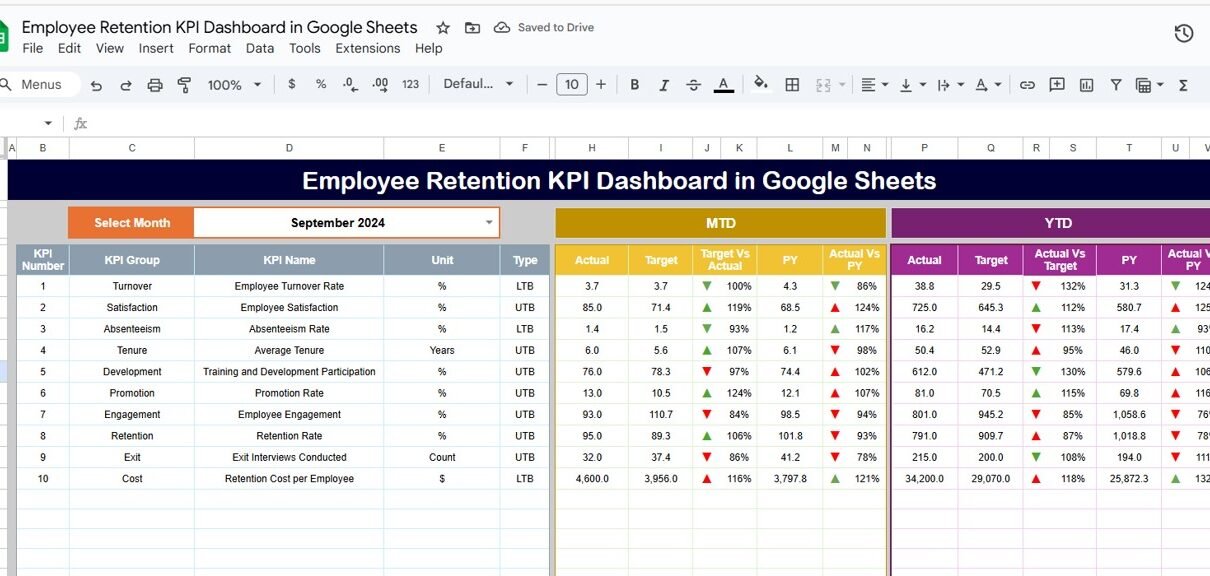
1. Dashboard Sheet Tab
This is the main analytics page.
You can select the month in Range D3, and the entire dashboard updates automatically.
It displays:
-
MTD Actual, Target, Previous Year (PY)
-
YTD Actual, Target, Previous Year (PY)
Conditional arrows to compare:
- Target vs Actual
- PY vs Actual

Click to Buy Employee Retention KPI Dashboard in Google Sheets
2. KPI Trend Sheet Tab
This sheet provides full details of any KPI.
You can select the KPI in Range C3, and the sheet will show:
-
KPI Group
-
Unit
-
KPI Type → Upper the Better / Lower the Better
-
Formula
-
KPI Definition
-
Trend Chart

Click to Buy Employee Retention KPI Dashboard in Google Sheets
3. Actual Number Sheet Tab
Enter the MTD and YTD actuals for each KPI.
Month selection is done in Range E1.

4. Target Sheet Tab
Enter targets for:
-
MTD
-
YTD
for each KPI.

Click to Buy Employee Retention KPI Dashboard in Google Sheets
5. Previous Year Number Sheet Tab
Enter previous year numbers for MTD and YTD comparison.

6. KPI Definition Sheet Tab
Contains:
-
KPI Name
-
KPI Group
-
Unit
-
Formula
-
KPI Definition
-
KPI Type (Upper / Lower the Better)

Click to Buy Employee Retention KPI Dashboard in Google Sheets
Advantages of Using This Dashboard
-
Complete employee retention analytics in one place
-
Improved visibility into turnover patterns
-
Better understanding of manager & department performance
-
Early identification of retention risks
-
Data-driven HR decision-making
-
Easy to update, share, and customize
Opportunities for Improvement
Click to Buy Employee Retention KPI Dashboard in Google Sheets
You can enhance the dashboard with:
-
Attrition forecasting using formulas
-
Predictive analysis (AI-based)
-
Employee sentiment scoring
-
Adding cost-to-replace calculation
-
Linking exit interview responses
-
Automated alerts for high-risk cases
Best Practices
-
Update employee data consistently
-
Standardize performance & engagement scoring
-
Review trends monthly
-
Compare across departments and managers
-
Use results to shape HR policies
-
Track early warning signs for high-risk employees
Conclusion
Click to Buy Employee Retention KPI Dashboard in Google Sheets
The Employee Retention KPI Dashboard in Google Sheets provides everything you need to track, analyze, and improve employee retention. With complete KPI monitoring, trends, and monthly targets, HR teams gain a deeper understanding of workforce stability and areas that require strategic attention.
This dashboard empowers organizations to reduce turnover, improve engagement, and build a strong, long-lasting workforce.
Frequently Asked Questions (FAQs)
1. What KPIs does this dashboard track?
It tracks retention, turnover, tenure, engagement, performance, and exit analysis.
2. Can I customize KPIs?
Yes, the KPI Definition tab allows complete customization.
3. Does the dashboard compare with targets and previous year?
Yes, it provides MTD/YTD comparison with both target and PY values.
4. Is Google Sheets suitable for HR dashboards?
Absolutely — it is flexible, cloud-based, and perfect for HR teams.
5. Will the dashboard update automatically?
Yes, the month dropdown updates all calculations instantly.
Visit our YouTube channel to learn step-by-step video tutorials
Youtube.com/@NeotechNavigators
Watch the step-by-step video Demo:
Click to Buy Employee Retention KPI Dashboard in Google Sheets