In today’s fast-paced business environment, optimizing energy consumption is not only an environmental necessity but also a financial advantage. With energy prices fluctuating and sustainability becoming increasingly important, businesses must track their energy usage efficiently. This is where an Energy KPI Dashboard in Google Sheets comes into play. It provides a powerful, user-friendly way to monitor, analyze, and manage energy consumption and efficiency across multiple departments or facilities. This article will explore how to create and utilize an Energy KPI Dashboard in Google Sheets, explaining key features, KPIs, and best practices for effective use.
Table of Contents
ToggleWhat is an Energy KPI Dashboard?
An Energy KPI Dashboard is a tool designed to help organizations track and manage their energy consumption and related activities. Key Performance Indicators (KPIs) such as energy usage, efficiency, and cost can be monitored using this dashboard. By inputting data into Google Sheets, companies can analyze energy performance, set goals, and compare current performance against targets, making it easier to make data-driven decisions regarding energy management.
Key Features of the Energy KPI Dashboard
The Energy KPI Dashboard in Google Sheets is an easy-to-use, ready-made template that helps organizations manage their energy consumption effectively. It comes with several worksheets that allow for detailed tracking and analysis. Below are the key features of the dashboard:
Dashboard Sheet Tab: This is the main sheet of the dashboard where all KPIs are displayed. Users can select the month from a drop-down menu in Range D3, and the entire dashboard will update accordingly. This sheet provides a comparison of MTD (Month-to-Date) Actual values, targets, and previous year data, along with visual indicators like Target vs Actual and PY vs Actual, using conditional formatting (up/down arrows).

Click to buy Energy KPI Dashboard in Google Sheets
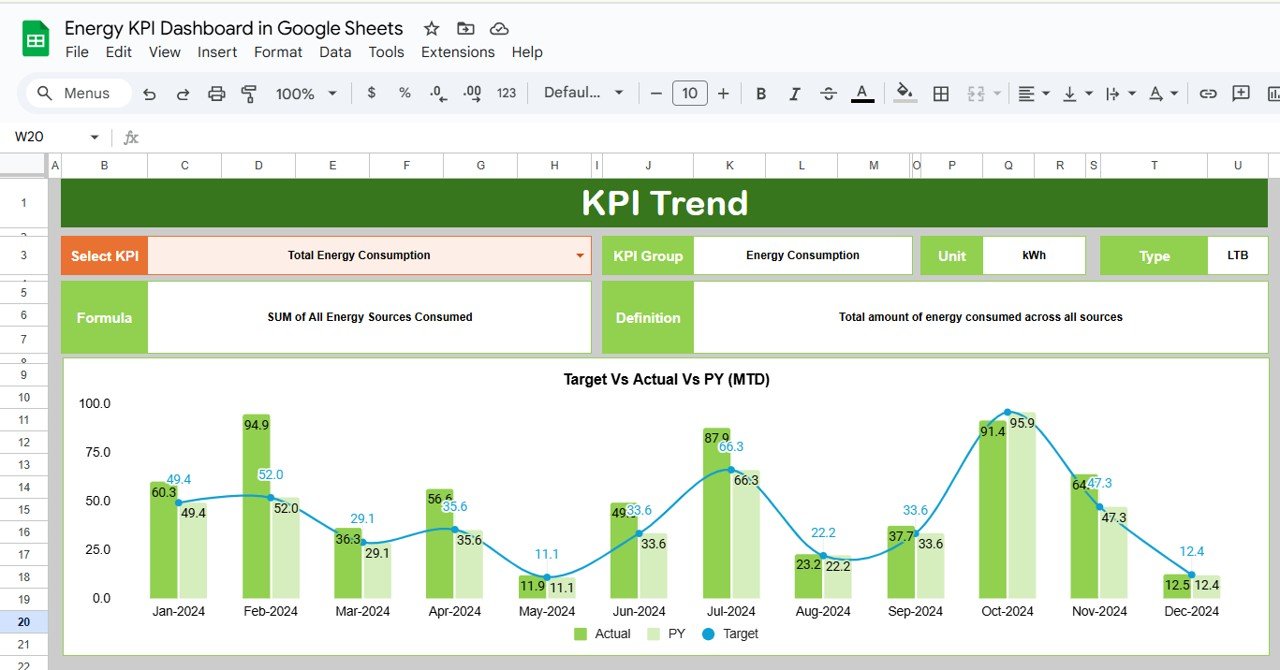
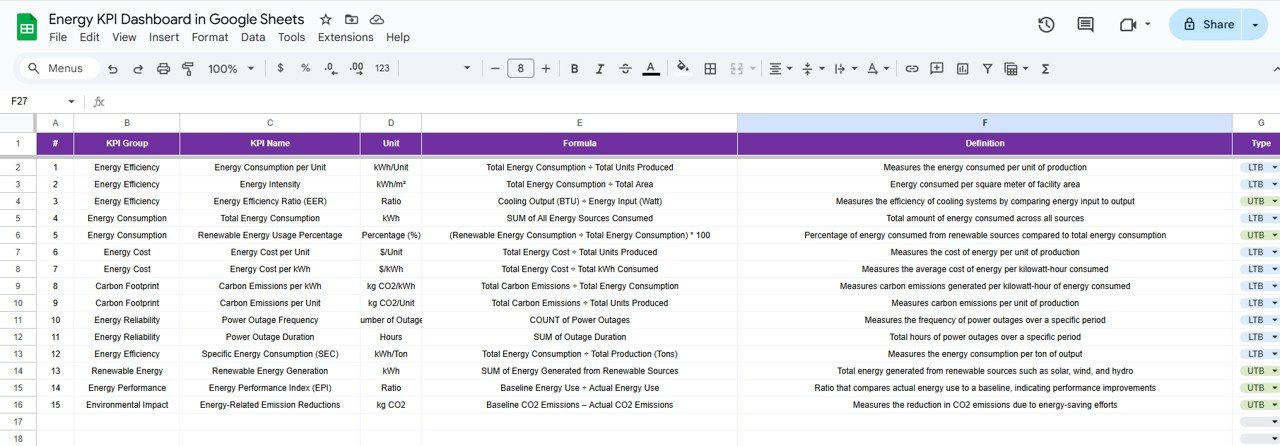
KPI Trend Sheet Tab: In this sheet, users can select any KPI from the drop-down menu available in Range C3. It displays the KPI Group, unit of measurement, the type of KPI (whether Lower the Better or Upper the Better), the formula to calculate the KPI, and its definition. This allows users to understand how each KPI is tracked and calculated.
Click to buy Energy KPI Dashboard in Google Sheets
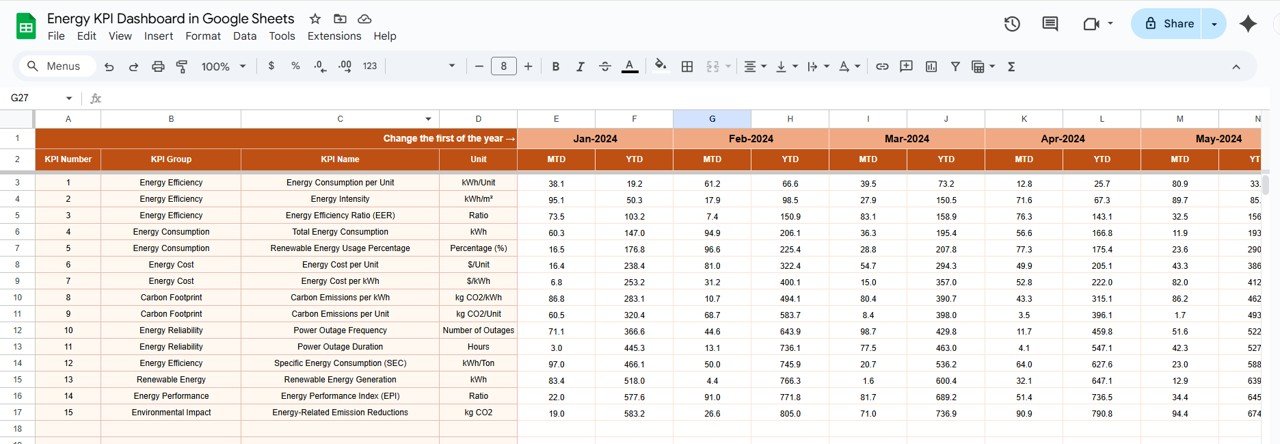
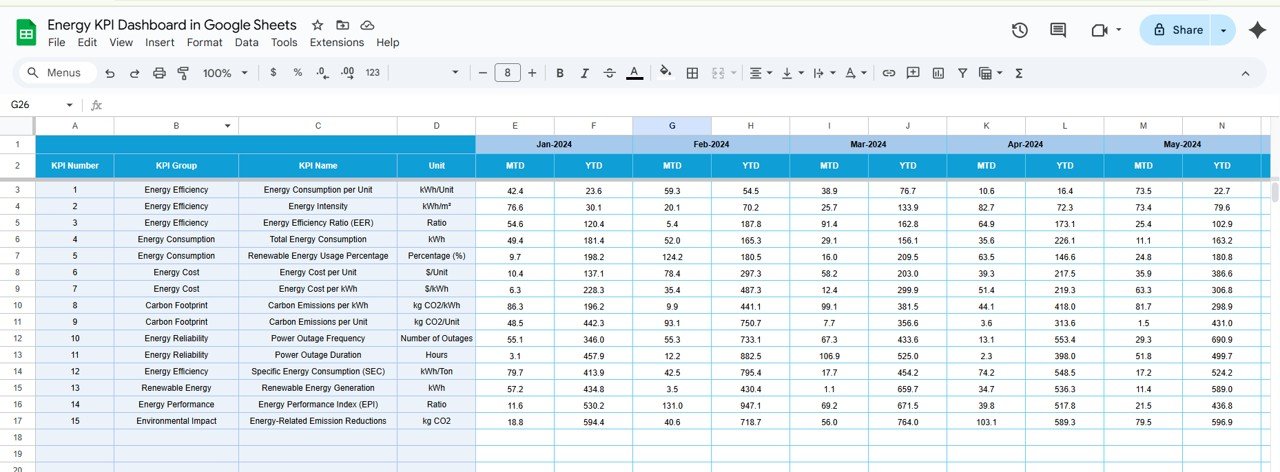
Actual Numbers Sheet Tab: This tab allows users to enter the actual energy data for the selected month. Users can change the month by modifying the value in Range E1. This data is crucial for comparing actual energy consumption with the target values.
Target Sheet Tab: In this sheet, users can input the target energy consumption values for both MTD and YTD (Year-to-Date) for each KPI. This is important for setting and tracking energy goals.
Click to buy Energy KPI Dashboard in Google Sheets
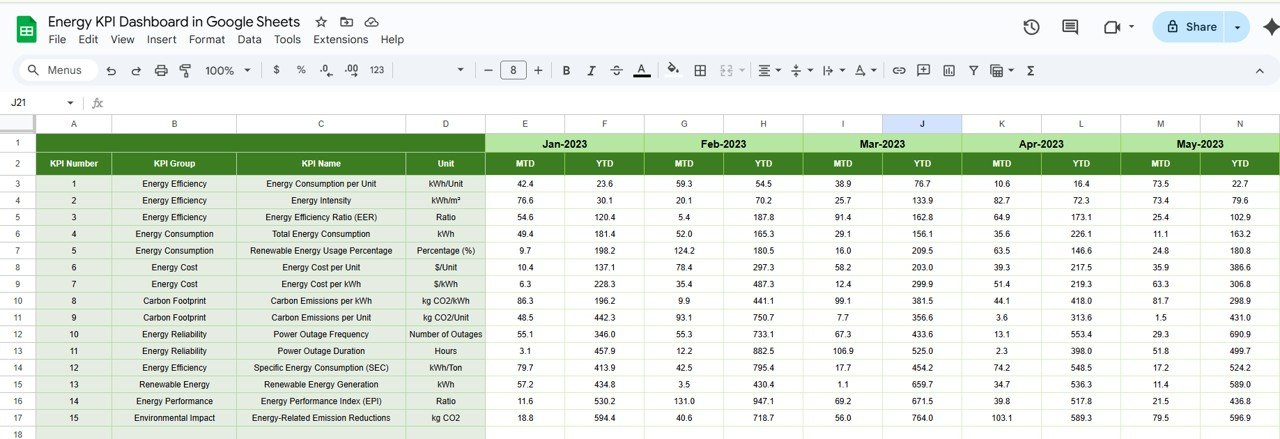
Previous Year Numbers Sheet Tab: This sheet is where users enter the data for energy consumption from the previous year. By comparing this data with current performance, businesses can identify trends and areas for improvement.
KPI Definition Sheet Tab: This sheet is used to document the name, group, unit, formula, and definition of each KPI. It serves as a reference guide to ensure consistency and clarity when working with the KPIs.
Click to buy Energy KPI Dashboard in Google Sheets
Advantages of Using the Energy KPI Dashboard
Implementing an Energy KPI Dashboard in Google Sheets offers several advantages that help businesses optimize their energy usage and improve sustainability:
-
Centralized Energy Data: All energy data is centralized in one place, making it easier for businesses to access, track, and analyze performance.
-
Real-time Data Updates: By selecting the desired month, the data is automatically updated in real-time, allowing businesses to make immediate decisions based on the most current data available.
-
Visual Representation: The dashboard uses charts and conditional formatting to visually represent energy consumption, cost, and other key metrics, making it easier for users to interpret the data at a glance.
-
User-Friendly: Google Sheets is easy to use, and the dashboard is designed to be intuitive. Users don’t need technical expertise to input data or use the dashboard effectively.
-
Cost-Effective: Google Sheets is free to use, making this dashboard a highly cost-effective solution for businesses of all sizes.
Opportunities for Improvement in the Energy KPI Dashboard
While the Energy KPI Dashboard is a powerful tool, there are always opportunities for improvement. Here are a few ways to enhance its effectiveness:
-
Automation: You can automate data input by integrating the dashboard with other systems, such as energy management platforms or IoT devices, to automatically pull energy data.
-
Advanced Reporting Features: Adding advanced reporting features such as predictive analytics, benchmarking, or integration with energy audits could improve the dashboard’s ability to help businesses plan for future energy needs.
-
Real-time Data from IoT: Integrating Internet of Things (IoT) sensors to collect real-time energy data can improve the accuracy and timeliness of the data input.
Best Practices for Using the Energy KPI Dashboard
Click to buy Energy KPI Dashboard in Google Sheets
To maximize the effectiveness of the Energy KPI Dashboard, organizations should follow these best practices:
-
Regular Data Entry: Regularly update the data to ensure the dashboard remains accurate and reflects the latest energy performance. Automating data entry is a great way to ensure this.
-
Clear Definitions and Standards: Ensure that all KPIs are well-defined, and that the team understands how they are calculated. This will help avoid confusion and ensure consistency.
-
Use Data for Decision Making: Use the insights gathered from the dashboard to drive decisions. For example, if energy consumption is higher than expected, investigate the cause and take action to reduce consumption.
-
Set Realistic Targets: Set achievable targets for each KPI. These targets should be based on historical data and aligned with sustainability goals.
-
Review Monthly: Review the dashboard monthly to evaluate energy performance and ensure that the company is on track to meet its energy goals.
Frequently Asked Questions (FAQs)
1. What is an Energy KPI Dashboard?
An Energy KPI Dashboard is a tool used to monitor and manage energy consumption, efficiency, and cost across an organization. It tracks key performance indicators (KPIs) related to energy usage, carbon emissions, and sustainability.
2. How do I set up an Energy KPI Dashboard in Google Sheets?
To set up the dashboard, simply download the pre-configured template, input your organization’s energy data, and customize the KPIs to reflect your business needs. The dashboard will automatically update based on the data you enter.
3. What KPIs should I track for energy management?
Essential KPIs to track include total energy consumption, energy cost, energy efficiency, renewable energy usage, and carbon emissions. These metrics help businesses assess their energy performance and sustainability efforts.
4. Can I automate the data entry for the Energy KPI Dashboard?
Yes, you can automate data entry by integrating the dashboard with other systems, such as energy management platforms or using Google Apps Script to pull data from external sources.
5. How often should I update the Energy KPI Dashboard?
Ideally, you should update the dashboard monthly to track progress and ensure that energy performance aligns with your goals.
Conclusion
The Energy KPI Dashboard in Google Sheets is a valuable tool for any organization looking to optimize its energy usage and improve sustainability efforts. With its ability to track key energy metrics, visualize data, and provide real-time insights, this dashboard enables businesses to make informed, data-driven decisions that contribute to both cost savings and environmental sustainability. By following the best practices and leveraging the opportunities for improvement, organizations can enhance the effectiveness of their energy management strategies, ensuring a greener and more efficient future
Visit our YouTube channel to learn step-by-step video tutorials
Youtube.com/@NeotechNavigators
Click to buy Energy KPI Dashboard in Google Sheets
Watch the step-by-step video Demo: