
As the fashion industry increasingly shifts towards sustainability and ethical practices, tracking key performance indicators (KPIs) is crucial for monitoring progress. The Ethical Fashion KPI Dashboard in Google Sheets provides a comprehensive tool for measuring and improving your ethical fashion practices. This dashboard helps fashion businesses track their environmental, social, and economic impact while aligning with sustainability goals. In this article, we will explore the key features of this dashboard, the KPIs it tracks, and how it supports your ethical fashion journey.
What is the Ethical Fashion KPI Dashboard?
The Ethical Fashion KPI Dashboard in Google Sheets is a powerful tool designed to track, manage, and optimize various aspects of your ethical fashion business. The dashboard covers several KPIs related to sustainability, including environmental impact, labor practices, material sourcing, and more. By using this dashboard, fashion brands can ensure they are meeting their sustainability targets while improving transparency and accountability.
The template includes multiple sheets for tracking KPIs, setting targets, and comparing current performance against historical data.
Key Features of the Ethical Fashion KPI Dashboard
The Ethical Fashion KPI Dashboard consists of six key worksheets, each providing different insights into your sustainability efforts:
1. Dashboard Sheet Tab
The Dashboard Sheet is the central hub of the KPI dashboard. It displays the following:
-
MTD (Month-to-Date) Actuals: Displays the current month’s actual performance.
-
YTD (Year-to-Date) Actuals: Displays the total performance for the year so far.
-
Target vs. Actual Comparison: Compares actual values against the set targets for both MTD and YTD, with conditional formatting to show up/down arrows for easy visual tracking.
-
Previous Year (PY) Comparison: Compares current-year performance against the previous year’s data.
-
Month Selector: A dropdown (Range D3) allows users to select the month, and the entire dashboard updates accordingly.

Click to buy Ethical Fashion KPI Dashboard in Google Sheets
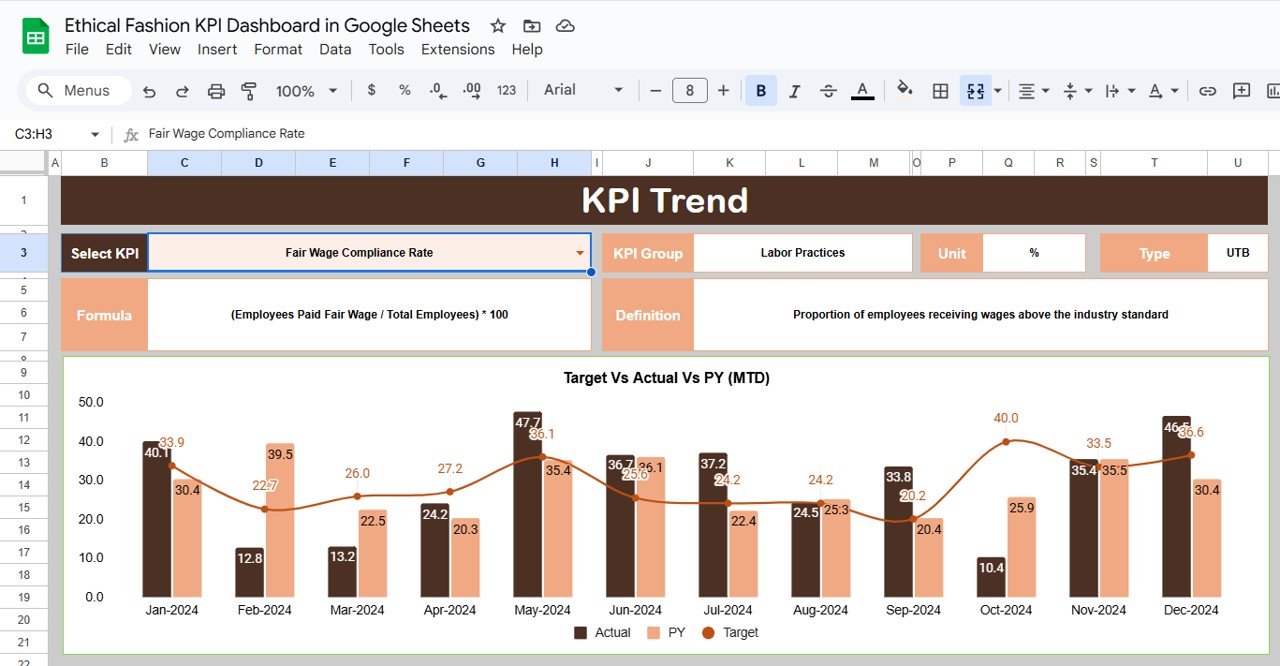
2. KPI Trend Sheet Tab
This sheet allows you to select specific KPIs from a dropdown (Range C3) and provides the following details:
-
KPI Group: The category to which the KPI belongs (e.g., Environmental Impact, Labor Practices).
-
Unit of KPI: The unit of measurement for each KPI (e.g., kilograms, percentage).
-
KPI Type: Whether the KPI is “Lower the Better” (LTB) or “Upper the Better” (UTB).
-
Formula: The formula used to calculate the KPI.
-
Definition: A brief explanation of what the KPI measures.
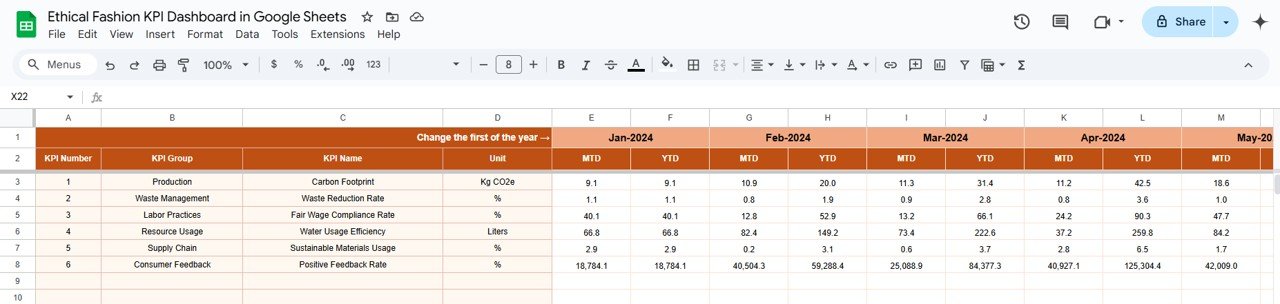
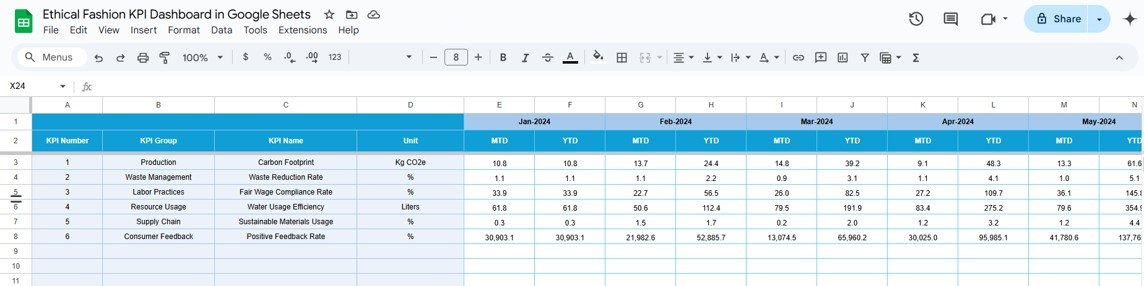
3. Actual Numbers Sheet Tab
The Actual Numbers Sheet is where you input the actual data for MTD and YTD. By changing the month in Range E1, the dashboard automatically updates the figures for the selected period.
Click to buy Ethical Fashion KPI Dashboard in Google Sheets
4. Target Sheet Tab
This sheet allows you to enter target values for each KPI, both for MTD and YTD, helping to measure how well you are meeting your sustainability objectives.
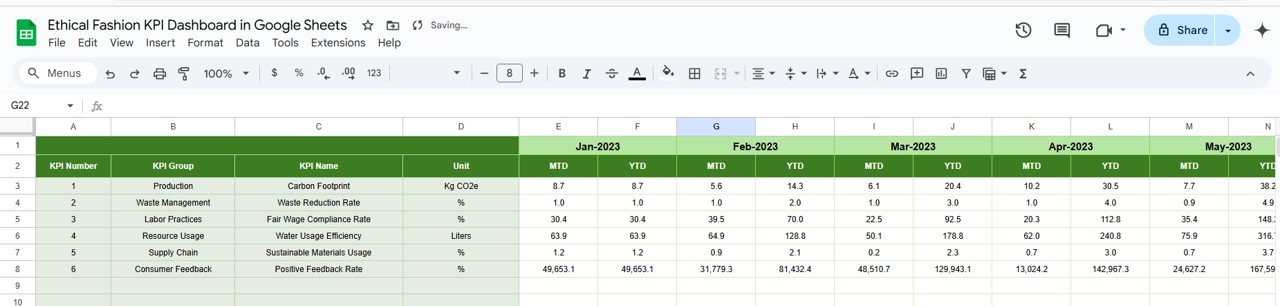
5. Previous Year Numbers Sheet Tab
Here, you input the data from the previous year, allowing you to compare year-over-year performance. This helps track progress and identify trends over time.
Click to buy Ethical Fashion KPI Dashboard in Google Sheets
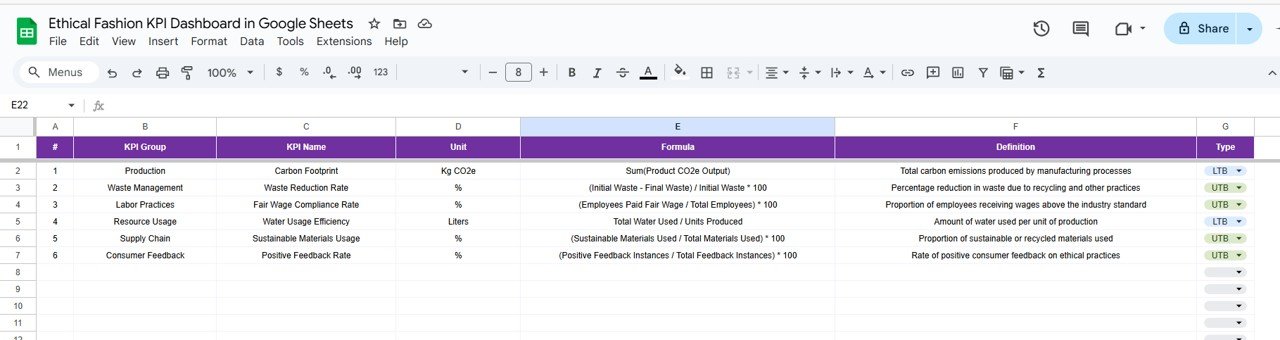
6. KPI Definition Sheet Tab
This sheet is a reference guide that includes definitions for each KPI. It ensures consistency and clarity when working with the dashboard.
-
KPI Name
-
KPI Group
-
Unit of Measurement
-
Formula
-
Definition
Advantages of Using the Ethical Fashion KPI Dashboard
-
Track Sustainability Metrics: Easily monitor environmental, social, and economic sustainability metrics across your business.
-
Real-Time Insights: View real-time data on key sustainability KPIs, enabling quick decisions to address underperforming areas.
-
Customizable: Modify KPIs, add new ones, and adjust formulas to align with your business’s sustainability goals.
-
Historical Comparisons: Compare current performance against past years and set benchmarks for improvement.
-
Informed Decision-Making: The dashboard provides data-driven insights that help businesses make informed, ethical decisions to improve their sustainability efforts.
Best Practices for Using the Ethical Fashion KPI Dashboard
Click to buy Ethical Fashion KPI Dashboard in Google Sheets
To get the most out of the Ethical Fashion KPI Dashboard, consider these best practices:
-
Update Regularly: Ensure that data is updated monthly or quarterly to keep the dashboard current.
-
Review Targets: Regularly assess your targets and compare them with actual performance to track progress.
-
Use Trend Analysis: Track KPIs over time using the KPI Trend Sheet to identify emerging trends and adjust strategies accordingly.
-
Engage Stakeholders: Share the dashboard with key stakeholders in the business to align sustainability goals and actions.
-
Adjust KPIs as Needed: Over time, adjust KPIs to ensure they remain aligned with your business’s evolving sustainability goals.
Conclusion
The Ethical Fashion KPI Dashboard in Google Sheets is an essential tool for any business looking to track and optimize its sustainability initiatives. By providing a clear and comprehensive view of key environmental, social, and economic metrics, this dashboard enables businesses to make informed, ethical decisions. It’s an invaluable asset for companies committed to improving their circular economy practices and reducing their environmental footprint.
Frequently Asked Questions (FAQs)
Click to buy Ethical Fashion KPI Dashboard in Google Sheets
1. What KPIs are most important for tracking in the Ethical Fashion KPI Dashboard?
Key KPIs for ethical fashion businesses include Carbon Footprint, Sustainable Materials Percentage, Fair Wages Paid, and Waste Recycled.
2. How can I update the data in the dashboard?
You can update the dashboard by entering your actual data for MTD and YTD in the Actual Numbers Sheet, and updating the Target Sheet as necessary.
3. Can I customize the KPIs in the dashboard?
Yes, the dashboard is customizable. You can add new KPIs, modify formulas, and adjust data fields to meet your specific sustainability goals.
4. How often should I update the dashboard?
It’s recommended to update the dashboard regularly, either monthly or quarterly, depending on your business’s reporting cycle.
5. How do I compare performance against last year?
You can compare current performance with previous year data by using the Previous Year Numbers Sheet to track year-over-year progress.
Visit our YouTube channel to learn step-by-step video tutorials
Youtube.com/@NeotechNavigators
Watch the step-by-step video Demo:

