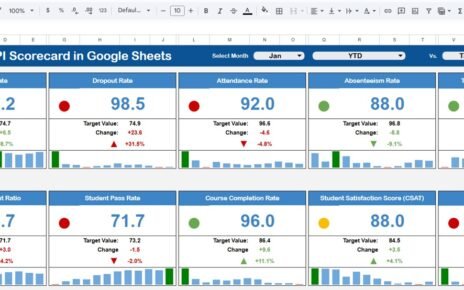
Exit interviews provide powerful insights into employee turnover, workplace culture, management effectiveness, and organizational strengths and weaknesses. But analyzing exit feedback manually can be complicated, slow, and inconsistent.Exit Interview KPI Dashboard in Google Sheets
The Exit Interview KPI Dashboard in Google Sheets is a ready-to-use solution that helps HR teams track exit trends, analyze reasons for employee turnover, measure satisfaction levels, and identify improvement opportunities. The dashboard provides a clear picture of why employees leave and what changes can improve retention.Exit Interview KPI Dashboard in Google Sheets
In this article, you will learn how the dashboard works, what KPIs it tracks, and how these metrics help strengthen organizational development.Exit Interview KPI Dashboard in Google Sheets
What Is the Exit Interview KPI Dashboard in Google Sheets?
Click to Buy Exit Interview KPI Dashboard in Google Sheets
This dashboard captures all exit interview–related insights and turns them into visual KPIs for HR and leadership teams. It helps companies:
-
Understand reasons for employee exits
-
Identify patterns by department, manager, tenure, and job level
-
Measure satisfaction and engagement trends among exiting employees
-
Compare MTD/YTD exit trends against targets and previous years
-
Drive retention-focused action plans
The dashboard provides data-driven clarity to reduce turnover and improve workplace culture.
Why Use Google Sheets for Exit Interview Analysis?
Google Sheets offers:
-
Cloud-based access
-
Real-time collaboration
-
Easy sharing for HR teams and leadership
-
Customizable KPIs and questions
-
Automated dashboards and charts
-
Zero cost
This makes it a perfect solution for organizations of every size.
Dashboard Structure and Sheet Tabs
Click to Buy Exit Interview KPI Dashboard in Google Sheets
The Exit Interview KPI Dashboard includes 6 major worksheets, each with a specific purpose.
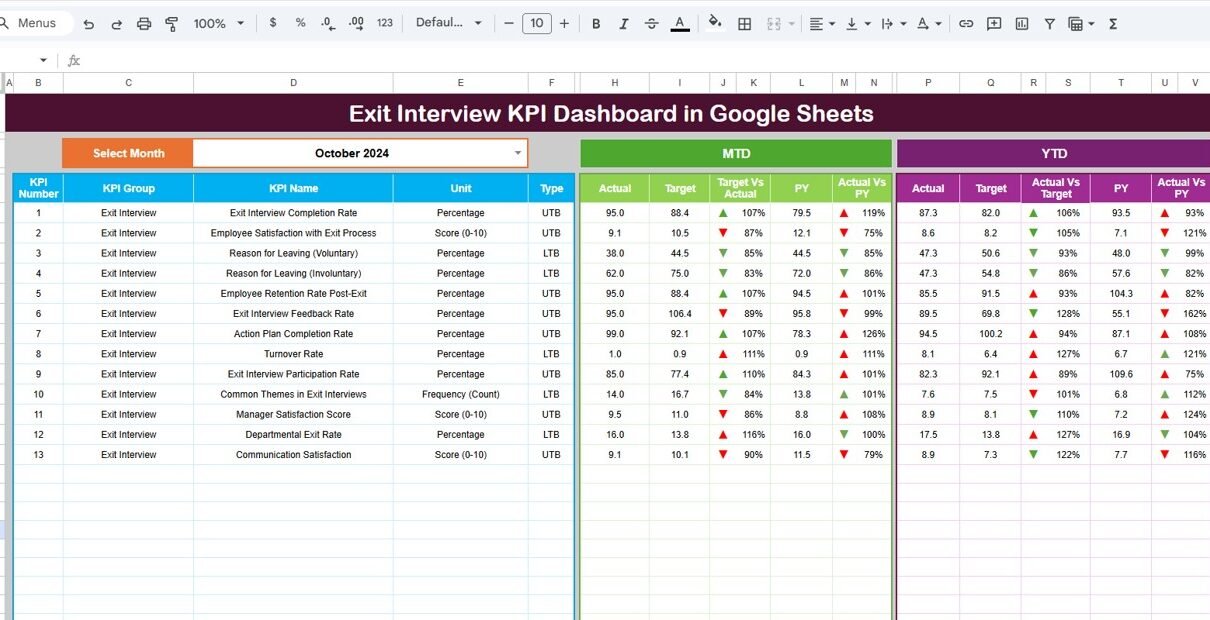
1. Dashboard Sheet Tab
This is the main analytics page.
Features Include:
-
Month selection at Range D3
-
Auto-update for all KPIs when month changes
Display of:
- MTD Actual, Target, Previous Year
- YTD Actual, Target, Previous Year
Conditional arrows for:
- Target vs Actual
- PY vs Actual
This enables quick, visual comparison of exit trends.

Click to Buy Exit Interview KPI Dashboard in Google Sheets
2. KPI Trend Sheet Tab
Choose the KPI in Range C3 to view:
-
KPI Group
-
Unit
-
KPI Type (Upper / Lower the Better)
-
KPI Formula
-
KPI Definition
-
Trend chart (month-wise performance)
Perfect for multi-month analysis.

Click to Buy Exit Interview KPI Dashboard in Google Sheets
3. Actual Number Sheet Tab
Enter:
-
MTD Actual values
-
YTD Actual values
Set the first month in Range E1.

4. Target Sheet Tab
Enter monthly and YTD targets for each KPI.

Click to Buy Exit Interview KPI Dashboard in Google Sheets
5. Previous Year Sheet Tab
Enter last year’s numbers to allow PY comparison.

6. KPI Definition Sheet Tab
Contains:
-
KPI Name
-
KPI Group
-
Unit
-
Formula
-
KPI Definition
-
Performance Type

Click to Buy Exit Interview KPI Dashboard in Google Sheets
Advantages of the Exit Interview Dashboard
-
Unified tracking of all exit data
-
Identifies toxic culture, poor leadership, and workload issues
-
Clear visualization of exit trends
-
Improves retention and talent stability
-
Helps HR develop better policies and training
-
Allows fast comparison with targets & previous year
-
Fully cloud-based and collaborative
Opportunities for Improvement
You can improve the dashboard with:
-
Sentiment analysis of exit comments
-
Integration with HRIS systems
-
Predictive turnover modeling
-
Automated exit survey forms
-
Individual manager scorecards
Best Practices
Click to Buy Exit Interview KPI Dashboard in Google Sheets
-
Conduct exit interviews consistently
-
Update the dashboard monthly
-
Track low performer vs high performer exits
-
Compare department turnover regularly
-
Address repeated exit reasons fast
-
Share findings with leadership
Conclusion
The Exit Interview KPI Dashboard in Google Sheets empowers HR teams to understand turnover deeply and develop smarter retention strategies. With clear KPIs, trend analysis, and actionable insights, companies can reduce costly turnover, improve workplace culture, and retain top talent.
Frequently Asked Questions (FAQs)
Click to Buy Exit Interview KPI Dashboard in Google Sheets
1. What KPIs does the dashboard track?
Exit trends, reasons for exit, satisfaction, engagement, manager performance, and department turnover.
2. Can I customize KPI definitions?
Yes, you can edit all KPIs in the KPI Definition Sheet.
3. Does the dashboard compare with targets and previous year?
Yes, it includes MTD/YTD comparisons with Target and PY.
4. Can multiple HR team members work on it?
Yes, Google Sheets supports real-time collaboration.
5. Is this dashboard suitable for large organizations?
Yes, it scales easily for companies of all sizes
Visit our YouTube channel to learn step-by-step video tutorials
Youtube.com/@NeotechNavigators
Watch the step-by-step video Demo: