Managing personal or business finances can often feel overwhelming, but with the right tools, you can streamline the process. One such tool is Google Sheets, which can be used to create a detailed Expense Report and Tracker In Google Sheet. In this article, we will guide you through creating a Google Sheets-based Expense Report and Tracker, a ready-to-use system that helps you manage and analyze your expenses effectively.
The tracker consists of three essential sheets: Expense Report, Expense Tracker, and Support Sheet. Each sheet plays a vital role in tracking and analyzing your spending, offering insights that help improve your financial decision-making.
Table of Contents
ToggleThe Expense Report Sheet: Overview and Insights
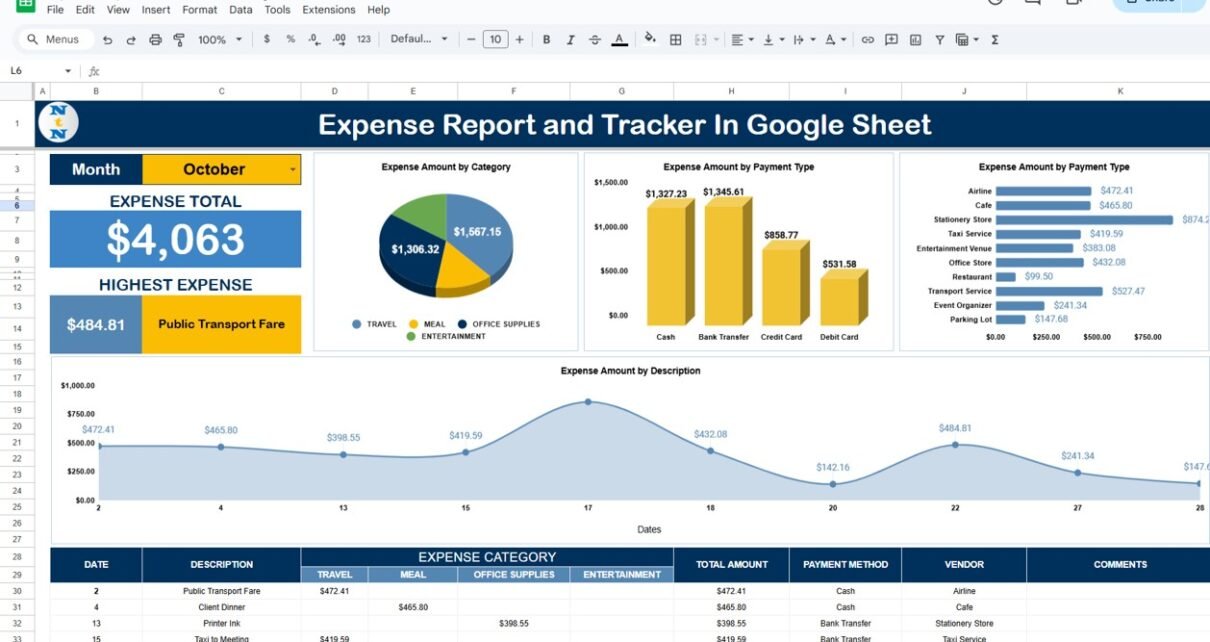
The Expense Report sheet is the core of the tracker, providing you with a high-level view of your spending for a specific month. It summarizes the expenses and displays visual charts to help you analyze your financial habits.
Structure of the Expense Report
Click to buy Expense Report and Tracker in Google Sheets
Top Section:
- Month: Select the month to track (e.g., October).
- Expense Total: The total expense for the selected month, automatically calculated based on the data entered in the tracker.
- Highest Expense: This shows the category with the highest expenditure during the month.
- Expense by Category: This section includes a Pie Chart that breaks down your expenses by category, such as Travel, Meals, Office Supplies, Entertainment, etc.
- Expense by Payment Type: Displayed through a Column Chart, this chart breaks down expenses by the method of payment, such as Cash, Credit Card, or Bank Transfer.
- Expense by Description: An Area Chart that helps identify patterns in your spending across different expense types, providing insights into where most of your money is going.
![]()
Middle Section
Click to buy Expense Report and Tracker in Google Sheets
The middle section contains the detailed breakdown of your expenses. This section includes the following columns:
- Date: The date the expense occurred.
- Description: A brief description of the expense (e.g., “Client Dinner”).
- Expense Category: The type of expense (e.g., “Meals”, “Travel”).
- Total Amount: The amount spent.
- Payment Method: The method used for the payment (e.g., “Cash”, “Credit Card”).
- Vendor: The store, restaurant, or service provider.
- Comments: Any additional details about the expense (e.g., purpose of the expense).
![]()
The Expense Tracker Sheet: Detailed Expense Entry
Click to buy Expense Report and Tracker in Google Sheets
The Expense Tracker sheet is where you log all of your expenses. This sheet acts as the database for all your expenses, feeding data into the Expense Report.
Structure of the Expense Tracker
This sheet includes the following columns:
- Month: The month of the expense.
- Day: The specific day the expense occurred.
- Description: The brief description of the expense (e.g., “Team Lunch”).
- Expense Category: The category the expense falls under (e.g., Travel, Meals, Office Supplies).
- Total Amount: The amount spent.
- Payment Method: The method used for payment (e.g., Cash, Credit Card).
- Vendor: The name of the vendor.
- Comments: Any additional details about the expense.
![]()
The Expense Tracker allows you to enter each expense in detail, keeping a comprehensive record of your spending. This will enable you to easily track and categorize your expenses, providing accurate and up-to-date data for your Expense Report.
Click to buy Expense Report and Tracker in Google Sheets
Support Sheet: Additional Data for Tracking
The Support Sheet contains additional data and support information that enhances the functionality of the tracker. This sheet might include lookup tables, predefined categories, or other auxiliary information to ensure smooth data entry and accurate calculations.
By keeping this sheet organized and well-maintained, you can ensure that the data in your Expense Tracker is consistent and reliable.
![]()
Advantages of Using an Expense Report and Tracker in Google Sheets
Click to buy Expense Report and Tracker in Google Sheets
- Real-Time Tracking: The Expense Tracker allows for real-time recording of all expenses. You can instantly see the data in the Expense Report, providing up-to-date financial information at your fingertips.
- Customization: Google Sheets provides the flexibility to modify the tracker to suit your unique needs. You can adjust the categories, add or remove data columns, and tailor the charts and graphs to your preference.
- Easy Sharing: Since it is cloud-based, you can easily share your tracker with colleagues, accountants, or business partners, making collaboration simple and efficient.
- Visual Insights: The various charts, including Pie Charts, Column Charts, and Area Charts, give you a clear visual representation of your spending habits. This helps you identify trends, such as overspending in certain categories.
Opportunities to Improve Your Expense Report and Tracker
While the tracker is effective, there are always opportunities for improvement. Here are a few suggestions:
- Automate Category Suggestions: Implement Google Sheets functions to automatically suggest categories based on the description of the expense.
- Add Currency Conversion: If you deal with multiple currencies, you can integrate a currency conversion feature into your tracker to convert foreign expenses to your base currency.
- Detailed Reporting: Expand the Expense Report to include year-over-year comparisons or a summary of expenses by vendor to track long-term trends.
- Integration with Bank Accounts: You can integrate the tracker with your bank accounts for automatic import of transactions. This will help save time and reduce manual entry.
Best Practices for Managing Your Expense Report and Tracker
To get the most out of your Expense Report and Tracker, follow these best practices:
- Consistency in Data Entry: Ensure that all expenses are entered promptly and accurately to maintain the integrity of your data.
- Regular Review: Set a weekly or monthly reminder to review your tracker. This will help you stay on top of your expenses and make adjustments if necessary.
- Categorize Each Expense: Always categorize your expenses to ensure that you can generate meaningful reports. This makes it easier to spot trends in your spending.
- Use Conditional Formatting: Use conditional formatting in Google Sheets to highlight unusual expenses or categories where spending exceeds a set budget.
- Backup Your Data: Regularly backup your tracker to prevent data loss. Google Sheets automatically saves changes, but it’s still a good idea to have an external copy for security.
Conclusion
The Expense Report and Tracker in Google Sheets is a powerful tool that helps you manage your expenses with ease. By organizing your data into clear categories, tracking payments, and using visual reports, you gain valuable insights into your spending habits. Whether you’re managing personal finances or business expenses, this tracker ensures that you remain in control and can make informed financial decisions.
Frequently Asked Questions (FAQ)
1. How do I create an Expense Report in Google Sheets?
To create an expense report in Google Sheets, start by creating a new sheet with columns for date, description, category, amount, payment method, and vendor. You can then use charts and formulas to summarize the data.
2. Can I customize the categories in the Expense Tracker?
Yes, Google Sheets allows you to easily customize the expense categories based on your preferences or the nature of your business.
3. How do I track expenses automatically in Google Sheets?
You can integrate Google Sheets with bank accounts or payment services using third-party add-ons to automatically import your expenses, reducing the need for manual entry.
4. How do I share my Expense Tracker with others?
Since Google Sheets is cloud-based, you can share your Expense Tracker with others by clicking the “Share” button at the top right of the sheet and choosing the recipients’ email addresses.
Visit our YouTube channel to learn step-by-step video tutorials
Youtube.com/@NeotechNavigators


