Factory automation has transformed modern manufacturing. Machines now work faster, systems run smarter, and production lines operate with minimal human intervention. However, automation alone does not guarantee success. Without proper performance tracking, even advanced factories struggle with inefficiencies, rising costs, and missed targets.
That is exactly where a Factory Automation KPI Dashboard in Google Sheets delivers real value.
This dashboard helps manufacturing leaders monitor automation performance using clear KPIs, real-time comparisons, and structured reporting. Instead of manually reviewing raw data, decision-makers gain instant insights into MTD, YTD, targets, trends, and deviations.
In this detailed article, you will learn what a Factory Automation KPI Dashboard in Google Sheets is, how it works, its worksheet-wise structure, key KPIs with units and definitions, advantages, best practices, and frequently asked questions. By the end, you will clearly understand how this dashboard improves factory performance and supports data-driven decisions.
What Is a Factory Automation KPI Dashboard in Google Sheets?
Click to Buy Factory Automation KPI Dashboard in Google Sheets
A Factory Automation KPI Dashboard in Google Sheets is a centralized performance monitoring tool designed to track and analyze key automation-related KPIs using an interactive Google Sheets interface.
Instead of using static reports or disconnected spreadsheets, this dashboard consolidates all KPIs into one structured system. Moreover, it updates automatically when users change the selected month or KPI.
Most importantly, the dashboard compares MTD (Month-to-Date), YTD (Year-to-Date), Targets, and Previous Year values, allowing managers to quickly identify gaps and opportunities.
Because it runs entirely in Google Sheets, the dashboard remains cloud-based, collaborative, and easy to maintain.
Why Is KPI Tracking Critical in Factory Automation?
Factory automation relies on machines, sensors, and systems working together seamlessly. However, even small inefficiencies can lead to production delays, quality issues, and higher operating costs.
Without KPI tracking, factories face several challenges:
- Limited visibility into automation performance
- Delayed identification of bottlenecks
- Manual and error-prone reporting
- Poor alignment between targets and actual results
A Factory Automation KPI Dashboard in Google Sheets solves these issues by converting raw production data into meaningful insights.
As a result, factories improve efficiency, reduce downtime, and achieve consistent performance improvements.
How Does a Factory Automation KPI Dashboard in Google Sheets Work?
Click to Buy Factory Automation KPI Dashboard in Google Sheets
This dashboard works by organizing KPI data across multiple structured worksheets.
Users enter actual values, target values, and previous year data in dedicated input sheets. After that, the dashboard automatically calculates comparisons and displays results using conditional formatting and trend visuals.
Moreover, users can select the month from a dropdown. As a result, all dashboard numbers update instantly without manual recalculation.
Because Google Sheets handles formulas and aggregation, users do not need advanced technical skills to operate the dashboard.
Worksheet-Wise Structure of the Factory Automation KPI Dashboard in Google Sheets
This dashboard includes six well-structured worksheets, each designed for a specific purpose. Let us explore them one by one.
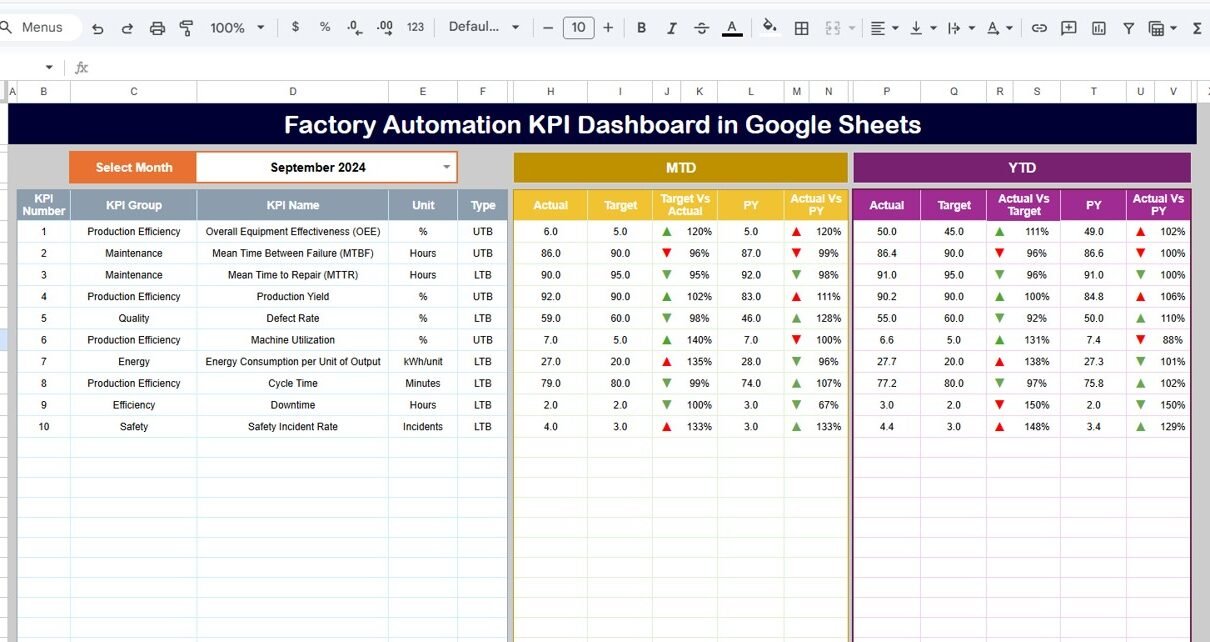
1. Dashboard Sheet Tab: What Is the Overall Automation Performance?
The Dashboard Sheet serves as the main control center of the entire system.
From this sheet, users get a complete overview of all factory automation KPIs for the selected month.
Key Features of the Dashboard Sheet
- Month selector available on cell D3
- Automatic refresh of all KPIs when the month changes
- Clear comparison of MTD Actual vs Target
- Comparison of YTD Actual vs Target
- Comparison with Previous Year values
- Conditional formatting with up/down arrows
KPIs Displayed on the Dashboard
For each KPI, the dashboard shows:
- MTD Actual
- MTD Target
- Target vs Actual variance
- Previous Year comparison
- YTD Actual
- YTD Target
- PY vs Actual comparison
Because of this structure, managers can immediately identify whether performance improves or declines.

Click to Buy Factory Automation KPI Dashboard in Google Sheets
2. KPI Trend Sheet Tab: How Is Each KPI Performing Over Time?
The KPI Trend Sheet focuses on deep KPI-level analysis.
Instead of reviewing all KPIs at once, users analyze one KPI at a time using a dropdown.
Key Features of the KPI Trend Sheet
-
KPI selection dropdown on cell C3
-
Display of KPI Group
-
KPI Unit of measurement
-
KPI Type: Lower the Better (LTB) or Upper the Better (UTB)
-
KPI Formula
-
KPI Definition
-
Trend visualization across months
Why KPI Trend Analysis Matters
This sheet helps users:
-
Understand long-term KPI behavior
-
Identify consistent improvement or decline
-
Validate whether automation initiatives deliver results
As a result, managers move from reactive decisions to proactive optimization.

Click to Buy Factory Automation KPI Dashboard in Google Sheets
3. Actual Number Sheet Tab: Where Do You Enter Current-Year Data?
The Actual Number Sheet captures real performance data.
Users enter MTD and YTD actual values for each KPI on this sheet.
Key Features of the Actual Number Sheet
-
Month selector on cell E1
-
Input for MTD Actual values
-
Automatic YTD aggregation
-
Structured layout for clean data entry
Why This Sheet Is Important
Accurate input drives accurate insights. Therefore, this sheet ensures that real production performance reflects correctly on the dashboard.

Click to Buy Factory Automation KPI Dashboard in Google Sheets
4. Target Sheet Tab: How Are Performance Goals Defined?
The Target Sheet defines performance expectations for each KPI.
Users enter target values for both MTD and YTD.
Key Features of the Target Sheet
-
KPI-wise monthly targets
-
Separate MTD and YTD target columns
-
Easy adjustment of goals based on business needs
Business Value of the Target Sheet
This sheet ensures alignment between automation strategy and measurable goals. As a result, teams stay focused on performance outcomes.

Click to Buy Factory Automation KPI Dashboard in Google Sheets
5. Previous Year Number Sheet Tab: How Does Performance Compare Historically?
The Previous Year Number Sheet stores last year’s performance data.
Users enter previous year values exactly as they do for the current year.
Why Previous Year Comparison Matters
This comparison helps factories:
-
Measure year-over-year improvement
-
Identify seasonal performance patterns
-
Validate automation ROI
Because of this historical context, decision-making becomes more accurate.

Click to Buy Factory Automation KPI Dashboard in Google Sheets
6. KPI Definition Sheet Tab: What Does Each KPI Mean?
The KPI Definition Sheet acts as the knowledge base of the dashboard.
Key Fields in the KPI Definition Sheet
-
KPI Name
-
KPI Group
-
Unit of Measurement
-
KPI Formula
-
KPI Definition
-
KPI Type (LTB / UTB)
Why KPI Definitions Are Critical
Clear definitions eliminate confusion. Moreover, they ensure that all stakeholders interpret KPIs consistently.

Who Should Use a Factory Automation KPI Dashboard in Google Sheets?
This dashboard suits multiple roles, including:
- Factory Managers
- Operations Heads
- Automation Engineers
- Production Managers
- Continuous Improvement Teams
- Manufacturing Consultants
Because of its flexibility, both small factories and large plants can use it effectively.
Best Practices for the Factory Automation KPI Dashboard in Google Sheets
Click to Buy Factory Automation KPI Dashboard in Google Sheets
To maximize value, follow these proven best practices.
1. Keep KPI Definitions Clear
Always document KPI logic in the KPI Definition sheet.
2. Update Data Regularly
Frequent updates ensure reliable MTD and YTD insights.
3. Track Actionable KPIs Only
Focus on KPIs that directly impact efficiency, cost, and output.
4. Review Trends Monthly
Trend analysis helps detect issues before they escalate.
5. Align Targets with Automation Strategy
Targets should reflect realistic automation goals and improvement plans.
How Does This Dashboard Support Continuous Improvement?
This dashboard supports continuous improvement by:
-
Highlighting inefficiencies early
-
Measuring automation ROI
-
Tracking progress against targets
-
Encouraging data-driven discussions
As a result, factories achieve sustainable performance gains.
Conclusion: Why Every Automated Factory Needs This Dashboard
Click to Buy Factory Automation KPI Dashboard in Google Sheets
A Factory Automation KPI Dashboard in Google Sheets bridges the gap between automation technology and performance management.
Instead of relying on assumptions or delayed reports, factories gain real-time visibility into KPIs that truly matter.
Moreover, the structured worksheet design ensures clarity, consistency, and ease of use.
In today’s competitive manufacturing environment, performance tracking defines success. Therefore, implementing this dashboard becomes a smart and strategic move for any automated factory.
Frequently Asked Questions (FAQs)
What data is required for a Factory Automation KPI Dashboard in Google Sheets?
You need KPI-wise actual values, targets, previous year numbers, and KPI definitions.
Can non-technical users operate this dashboard?
Yes, the dashboard uses simple inputs, dropdowns, and automated calculations.
Does the dashboard support monthly performance tracking?
Yes, users select the month, and all KPIs update automatically.
Can I customize KPIs in this dashboard?
Yes, users can add, remove, or modify KPIs easily.
Is Google Sheets suitable for factory KPI dashboards?
Yes, Google Sheets offers flexibility, collaboration, and ease of use.
Can this dashboard support continuous improvement programs?
Yes, trend analysis and target comparisons directly support improvement initiatives.
Visit our YouTube channel to learn step-by-step video tutorials
Youtube.com/@NeotechNavigators
Watch the step-by-step video tutorial:
Click to Buy Factory Automation KPI Dashboard in Google Sheets