Environmental performance has become a core priority for modern organizations. However, many teams still track sustainability metrics using scattered spreadsheets or manual reports. As a result, visibility remains low, trends stay hidden, and decisions become reactive.
That is exactly where an Environmental KPI Scorecard in Google Sheets adds real value.
In this practical blog post, you will learn what an Environmental KPI Scorecard in Google Sheets is, how it works, its sheet-wise structure, key features, advantages, best practices, and frequently asked questions. By the end, you will clearly understand how this ready-to-use scorecard helps organizations monitor environmental performance with clarity and confidence.
What Is an Environmental KPI Scorecard in Google Sheets?
An Environmental KPI Scorecard in Google Sheets is a structured and visual performance tracking template designed to monitor key environmental and sustainability KPIs in one place.
Instead of reviewing raw data, this scorecard displays performance using traffic lights, up/down arrows, percentage changes, and trends. Moreover, because it runs on Google Sheets, teams can access and update it in real time.
As a result, sustainability teams gain instant clarity on environmental performance at both monthly (MTD) and yearly (YTD) levels.
Why Should You Use an Environmental KPI Scorecard?
Click to Buy Environmental KPI Scorecard In Google Sheets
Environmental reporting involves multiple metrics such as energy usage, emissions, waste, and compliance. Therefore, tracking them manually becomes time-consuming.
Without a scorecard:
-
KPI tracking becomes inconsistent
-
Monthly and yearly comparisons remain unclear
-
Performance issues surface too late
However, an Environmental KPI Scorecard in Google Sheets centralizes all KPIs and automates analysis. Consequently, decision-making becomes faster and more data-driven.
How Does the Environmental KPI Scorecard in Google Sheets Work?
The scorecard works through a simple and effective process:
-
Input environmental data in a structured data sheet
-
Select a month from the drop-down at the top
-
View KPI performance using traffic lights and arrows
-
Switch between MTD and YTD with a single click
-
Analyze trends using the Trend Sheet
Because of this design, users can analyze performance without modifying formulas or layouts.
What Are the Key Features of the Environmental KPI Scorecard?
Click to Buy Environmental KPI Scorecard In Google Sheets
This ready-to-use template includes multiple features that make environmental reporting easy and reliable.
Month Selection Drop-Down
At the top of the scorecard, a month drop-down allows users to select any reporting month. Once selected, all KPI values update automatically.
MTD and YTD Toggle
Users can switch between:
-
MTD (Month-to-Date) to analyze monthly performance
-
YTD (Year-to-Date) to analyze annual performance
As a result, both short-term and long-term insights become available instantly.
Traffic Lights and Up/Down Arrows
The scorecard uses:
-
Traffic light indicators to show KPI status
-
Up and down arrows to display percentage change
Therefore, users can identify performance issues at a glance.
What Sheets Are Included in the Environmental KPI Scorecard?
The scorecard contains multiple structured sheets, each with a clear purpose.
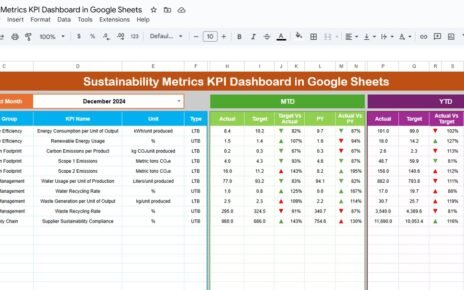
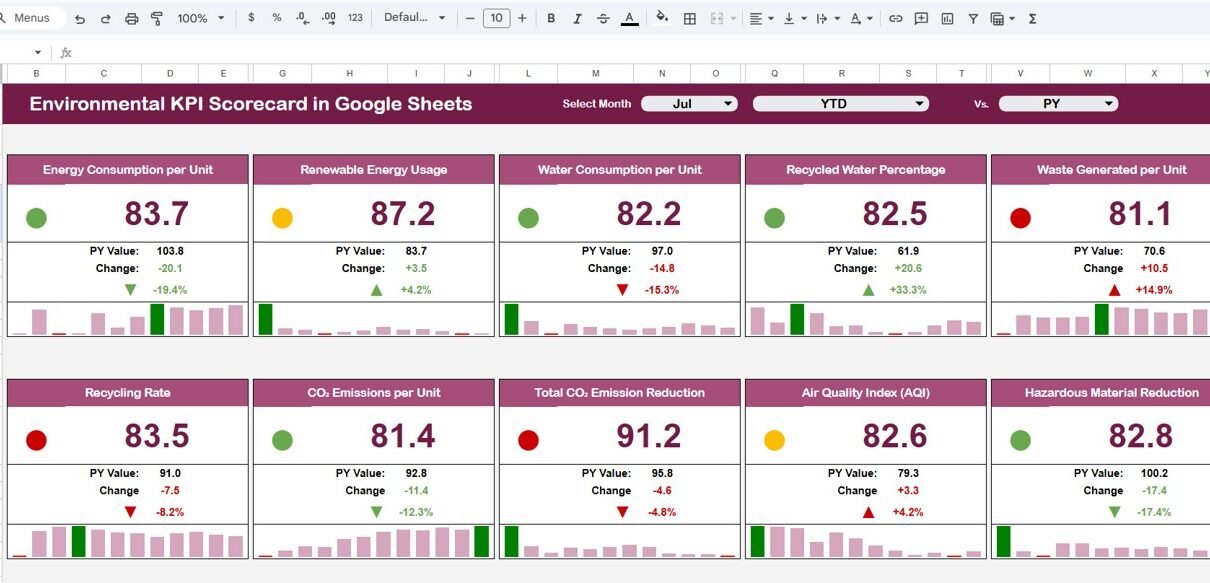
Scorecard Sheet: What Does It Show?
The Scorecard Sheet acts as the main dashboard.
Key Highlights:
-
Tracks 10 different Environmental KPIs
-
Displays actual performance vs targets
-
Shows traffic light indicators
-
Highlights percentage change with arrows
-
Supports MTD and YTD analysis
Because of this layout, stakeholders can review environmental performance in seconds.

Click to Buy Environmental KPI Scorecard In Google Sheets
Trend Sheet: How Can You Analyze KPI Trends?
The Trend Sheet focuses on individual KPI analysis over time.
Key Features of the Trend Sheet:
-
KPI selection drop-down available at cell C3
Displays:
- KPI Group
- KPI Unit
- KPI Type (Lower the Better / Upper the Better)
Shows trend movement visually
As a result, users can easily track whether a KPI improves or deteriorates over time.

Click to Buy Environmental KPI Scorecard In Google Sheets
KPI Definition Sheet: Why Is It Important?
The KPI Definition Sheet acts as a reference and control sheet.
In This Sheet, You Enter:
-
KPI Name
-
KPI Group
-
Unit of Measurement
-
Formula
-
KPI Definition
Because definitions remain centralized, teams maintain consistency across reporting periods.

Click to Buy Environmental KPI Scorecard In Google Sheets
Data Input Sheet: Where Do You Enter the Data?
The Data Input Sheet is where users enter raw environmental data.
Key Benefits:
-
Simple and structured layout
-
Easy monthly data entry
-
Automatic linkage to the scorecard
Once data is updated, all scorecard visuals refresh automatically.

Click to Buy Environmental KPI Scorecard In Google Sheets
Colour Settings Sheet: Why Does It Matter?
The Colour Settings Sheet controls:
-
Traffic light colors
-
Arrow colors
-
Threshold logic
This sheet allows customization without touching formulas. Therefore, users can align the scorecard with internal reporting standards.

Click to Buy Environmental KPI Scorecard In Google Sheets
What Environmental KPIs Can You Track?
This scorecard supports tracking of common environmental KPIs such as:
- Energy Consumption
- Water Usage
- Carbon Emissions
- Waste Generation
- Recycling Rate
- Compliance Rate
- Renewable Energy Usage
- Emission Intensity
- Environmental Incidents
- Sustainability Target Achievement
Because the template is flexible, users can replace KPIs as needed.
Advantages of Environmental KPI Scorecard in Google Sheets
Centralized Sustainability Tracking
All environmental KPIs remain in one structured location. As a result, reporting becomes consistent.
Real-Time Collaboration
Since the scorecard runs on Google Sheets, multiple users can work simultaneously.
Clear Visual Indicators
Traffic lights and arrows highlight issues instantly. Therefore, managers act faster.
No Advanced Tools Required
Teams can track ESG performance without Power BI or complex systems.
Easy Customization
Users can modify KPIs, thresholds, and colors effortlessly.
Best Practices for the Environmental KPI Scorecard in Google Sheets
Click to Buy Environmental KPI Scorecard In Google Sheets
Keep Data Clean and Consistent
Always enter data in the correct format and time period.
Review KPI Definitions Regularly
Ensure KPI formulas and definitions remain aligned with sustainability goals.
Update Data Monthly
Regular updates ensure accurate MTD and YTD insights.
Avoid Manual Overrides
Let formulas and rules control indicators instead of hard-coding values.
Protect Calculation Sheets
Lock formula and color setting sheets to avoid accidental changes.
Who Can Use This Environmental KPI Scorecard?
Click to Buy Environmental KPI Scorecard In Google Sheets
This scorecard works well for:
-
Sustainability teams
-
ESG managers
-
Environmental compliance officers
-
Manufacturing companies
-
Corporate ESG reporting teams
-
Consultants and auditors
Because it uses Google Sheets, adoption remains quick and simple.
Conclusion:
Is an Environmental KPI Scorecard in Google Sheets Worth Using?
Yes, absolutely.
An Environmental KPI Scorecard in Google Sheets transforms raw sustainability data into clear, actionable insights. It simplifies monthly and yearly reporting, improves visibility, and supports better environmental decisions.
If you want a flexible, visual, and easy-to-use solution for environmental performance tracking, this scorecard delivers exactly that.
Frequently Asked Questions (FAQs)
Click to Buy Environmental KPI Scorecard In Google Sheets
What is an Environmental KPI Scorecard in Google Sheets?
It is a ready-to-use template that tracks environmental KPIs using visuals, MTD/YTD views, and trends.
How many KPIs can this scorecard track?
The default template tracks 10 KPIs, but users can easily add more.
Can I customize KPI thresholds and colors?
Yes, you can customize them using the Colour Settings sheet.
Do I need advanced Google Sheets skills?
No, basic Google Sheets knowledge is enough to use and update the scorecard.
Can multiple users access the scorecard?
Yes, Google Sheets allows real-time collaboration.
Visit our YouTube channel to learn step-by-step video tutorials
Youtube.com/@NeotechNavigators
Watch the step-by-step video tutorial: