Insurance brokers handle large volumes of policies, agents, commissions, and payments every single month. However, many brokers still depend on raw spreadsheets, manual summaries, and delayed reports. As a result, tracking performance becomes slow, error-prone, and reactive.
That is exactly where an Insurance Brokers Dashboard in Google Sheets creates real value.
In this article, we will explain the Insurance Brokers Dashboard in Excel in Google Sheets, its structure, pages, features, advantages, best practices, and frequently asked questions. By the end of this guide, you will clearly understand how this ready-to-use Google Sheets dashboard helps insurance brokers monitor business performance with clarity and confidence.
What Is an Insurance Brokers Dashboard in Google Sheets?
An Insurance Brokers Dashboard in Google Sheets is a structured and interactive reporting solution designed to track insurance policies, premiums, commissions, agents, and payment performance in one place.
Instead of reviewing long tables, this dashboard presents key metrics using KPI cards, charts, slicers, and trend analysis. Moreover, because it runs on Google Sheets, teams can access, update, and share the dashboard in real time.
As a result, insurance brokers gain instant visibility into sales performance, agent productivity, revenue, and policy status.
Why Do Insurance Brokers Need a Dashboard?
Click to Buy Insurance Brokers Dashboard in Google Sheets
Insurance brokerage operations involve multiple moving parts. Therefore, managing them manually leads to inefficiencies.
Without a dashboard:
-
Policy tracking becomes inconsistent
-
Agent performance stays unclear
-
Commission analysis takes too much time
-
Revenue trends remain hidden
However, an Insurance Brokers Dashboard in Google Sheets centralizes all critical data. Consequently, decision-making becomes faster and more data-driven.
How Does the Insurance Brokers Dashboard Work?
The dashboard follows a simple and powerful workflow:
- Enter policy and transaction data in the data table
- Use slicers to filter by insurance type, agent, region, policy status, or payment mode
- View KPIs and charts that update automatically
- Analyze trends across months, agents, and commission types
Because of this setup, users can explore insights without touching formulas.
What Are the Key Features of the Insurance Brokers Dashboard?
This ready-to-use dashboard includes multiple professional features designed for insurance reporting.
Interactive Slicers at the Top
Each page includes slicers for:
- Insurance Type
- Agent Region
- Policy Status
- Payment Mode
- Agent Name
Therefore, users can instantly filter the entire dashboard.
KPI Cards for Quick Insights
The dashboard displays high-level KPIs such as:
- Number of Policies
- Total Premium Collected
- Total Commission Paid
- Average Premium Amount
- Expired Policies
As a result, management can review performance at a glance.
What Pages Are Included in the Insurance Brokers Dashboard?
Click to Buy Insurance Brokers Dashboard in Google Sheets
This dashboard includes six well-structured analytical pages, each focused on a specific business area.
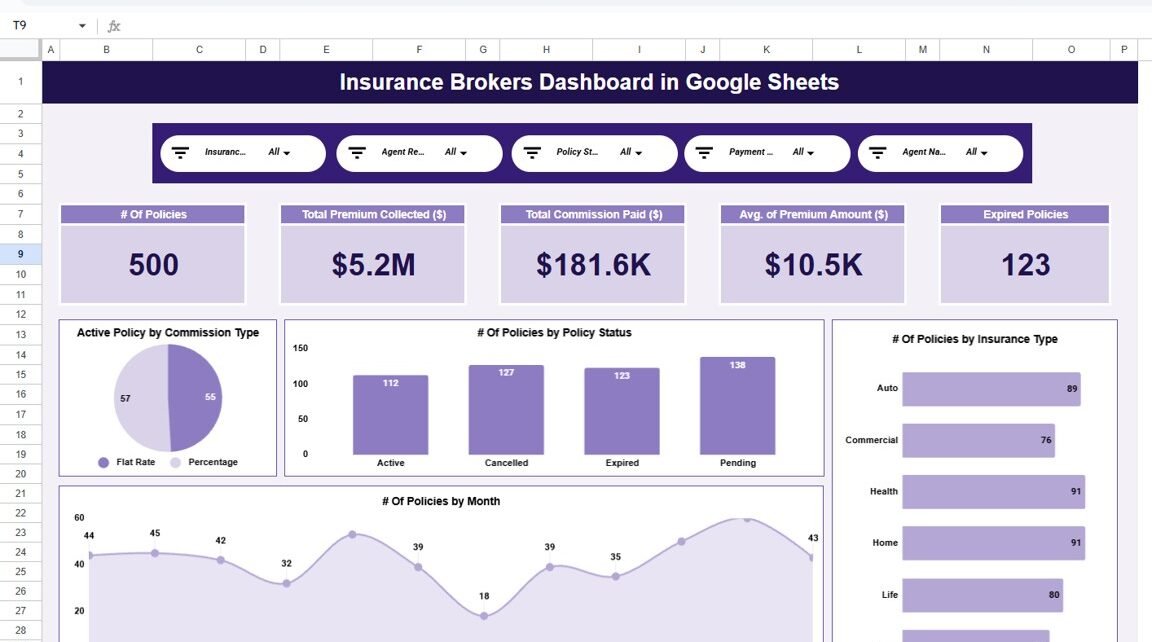
Overview Page: What Does the Overview Show?
The Overview Page acts as the main landing page of the dashboard.
Key Highlights of the Overview Page:
- Total number of policies
- Total premium collected
- Total commission paid
- Average premium amount
- Total expired policies
Charts Included:
- Active Policy by Commission Type
- Number of Policies by Policy Status
- Number of Policies by Insurance Type
- Policies and premium trends by month
Because of this layout, stakeholders get a complete snapshot of the business instantly.

Click to Buy Insurance Brokers Dashboard in Google Sheets
Agent Performance Page: How Do Agents Perform?
The Agent Performance page focuses on agent-wise productivity and efficiency.
Key Insights on This Page:
-
Active policies by agent region
-
Number of policies by agent name
-
Expired policies by agent name
-
Total premium vs commission by agent
As a result, brokers can identify top performers and underperformers quickly.

Click to Buy Insurance Brokers Dashboard in Google Sheets
Commission Analysis Page: How Are Commissions Structured?
The Commission Analysis page analyzes commission performance across commission types.
Charts Included:
-
Active policy by commission type
-
Number of policies by commission type
-
Expired policy by commission type
-
Premium collected vs commission paid
Therefore, brokers can understand which commission structure performs better.

Click to Buy Insurance Brokers Dashboard in Google Sheets
Policy Revenue & Payouts Page: How Does Revenue Flow?
The Policy Revenue & Payouts page focuses on payment modes and revenue distribution.
Key Visuals:
-
Total premium collected by payment mode
-
Number of policies by payment mode
-
Active policies by payment mode
-
Expired policies by payment mode
This page helps brokers optimize payment strategies and reduce policy lapses.

Click to Buy Insurance Brokers Dashboard in Google Sheets
Monthly Trends Page: How Does Performance Change Over Time?
The Monthly Trends page provides time-based insights.
Key Charts:
-
Number of policies by month
-
Total premium collected by month
-
Expired policies by month
As a result, brokers can spot seasonal patterns and performance spikes.

Click to Buy Insurance Brokers Dashboard in Google Sheets
Search & Detailed Data Page: How Can You Drill Down?
This page allows users to search and filter records using:
-
Search keyword
-
Selected column
Key Benefits:
- View total record count
- Filter by payment mode or agent
- Analyze policy-level details instantly
This feature supports audits and detailed reviews.

Click to Buy Insurance Brokers Dashboard in Google Sheets
What Data Is Captured in the Dashboard?
The dashboard tracks detailed insurance data, including:
- Policy ID
- Agent Name and Region
- Insurance Type
- Client Name
- Policy Start and End Dates
- Policy Status
- Premium Amount
- Commission Type and Rate
- Commission Earned
- Payment Mode
Because of this structure, reporting remains accurate and flexible.
Advantages of Insurance Brokers Dashboard in Google Sheets
Centralized Insurance Reporting
All policy, agent, and commission data stays in one place.
Faster Decision-Making
Interactive visuals highlight issues instantly.
Improved Agent Performance Tracking
Agent-wise insights help improve accountability.
Real-Time Collaboration
Google Sheets allows multiple users to work together.
No Complex Tools Required
You get professional analytics without Power BI or SQL.
Easy Customization
You can add new KPIs, agents, or insurance types easily.
Best Practices for Insurance Brokers Dashboard in Google Sheets
Click to Buy Insurance Brokers Dashboard in Google Sheets
Maintain Clean Data
Always enter complete and accurate policy data.
Update Data Regularly
Monthly updates ensure reliable trend analysis.
Standardize Policy Status Values
Use consistent labels like Active, Cancelled, Expired, and Pending.
Protect Formula Sheets
Lock calculation areas to prevent accidental edits.
Review KPIs Monthly
Track expired policies and commissions proactively.
Who Can Use This Dashboard?
This dashboard suits:
-
Insurance Brokers
-
Insurance Agencies
-
Sales Managers
-
Finance Teams
-
Operations Teams
-
Business Owners
Because it uses Google Sheets, onboarding remains quick.
Conclusion: Is the Insurance Brokers Dashboard in Google Sheets Worth Using?
Click to Buy Insurance Brokers Dashboard in Google Sheets
The Insurance Brokers Dashboard in Excel in Google Sheets transforms raw insurance data into meaningful insights. It improves visibility, simplifies reporting, and supports smarter decisions across policies, agents, commissions, and revenue.
If you want a reliable, interactive, and easy-to-use insurance analytics solution, this dashboard delivers exactly what you need.
Frequently Asked Questions (FAQs)
What is an Insurance Brokers Dashboard in Google Sheets?
It is a ready-to-use reporting template that tracks policies, premiums, commissions, and agent performance.
Can I filter data by agent and policy status?
Yes, slicers allow dynamic filtering across all pages.
Do I need advanced Google Sheets skills?
No, basic knowledge is sufficient to use this dashboard.
Can I customize KPIs and charts?
Yes, the dashboard is fully customizable.
Can multiple users access the dashboard?
Yes, Google Sheets supports real-time collaboration.
Visit our YouTube channel to learn step-by-step video tutorials
Youtube.com/@NeotechNavigators
Watch the step-by-step video tutorial: