When you’re working with large datasets, filtering becomes one of the most crucial tasks for narrowing down your focus to just the relevant data. Fortunately, Power Query in Power BI offers a variety of tools to filter rows based on specific criteria. This makes it easier to include only the necessary data in your reports, which not only simplifies your analysis but also improves performance. Whether you’re excluding certain values, filtering based on specific conditions, or applying more advanced methods, Power Query makes this process simple and efficient. Let’s walk through different ways you can filter rows in Power Query to help clean and refine your data.
Why Is Filtering Important in Data Analysis?
Filtering is essential because it helps you focus only on the data that matters to your analysis. By removing irrelevant information, you can spot meaningful patterns and trends more easily. Additionally, filtering simplifies your dataset, enhances performance, and makes your visualizations clearer. In Power BI, effective filtering leads to faster report generation and more insightful analysis.
Methods for Filtering Rows in Power Query
Now that you understand the importance of filtering, let’s explore the different methods available in Power Query to make this process easier.
Basic Filtering Using Dropdown Menus
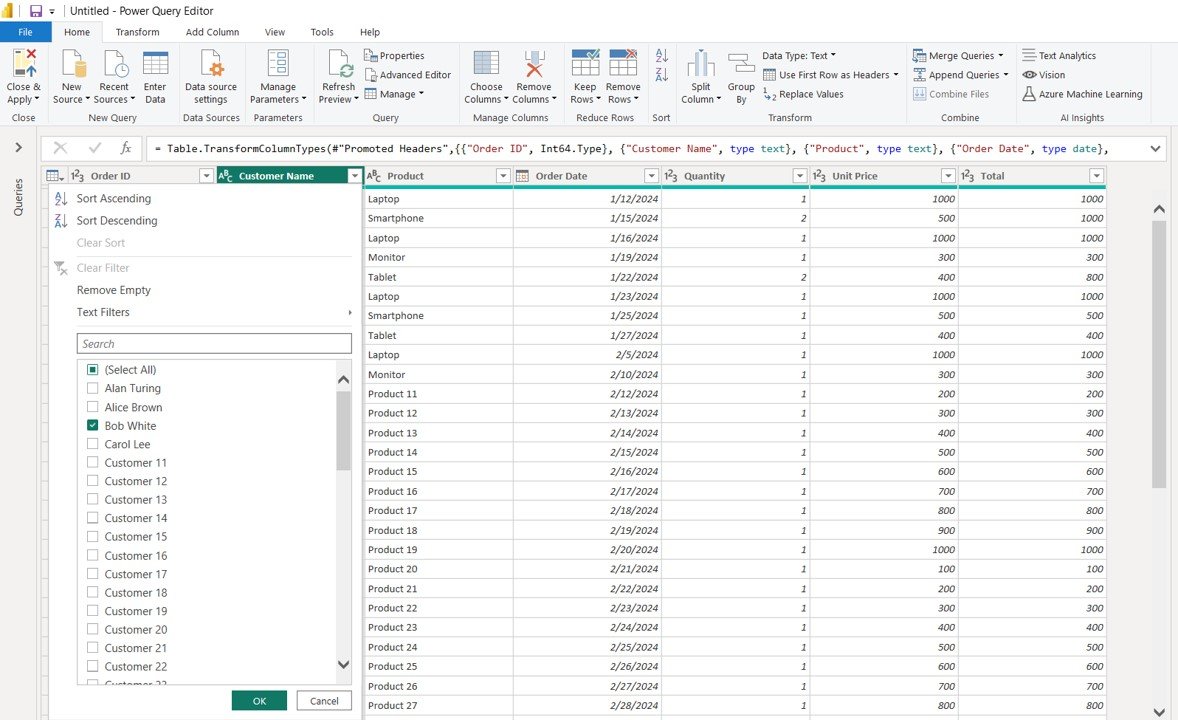
One of the easiest and most straightforward ways to filter your data in Power Query is by using dropdown menus. This method works best when you need to filter by specific values like customer names, products, or dates.
Steps to Filter Using Dropdown Menus:
- Open Power Query Editor in Power BI.
- Click the dropdown arrow in the column header you want to filter.
- In the dropdown list, check or uncheck the values you wish to include or exclude.
- Click OK to apply the filter.
Filtering Rows by Text Criteria
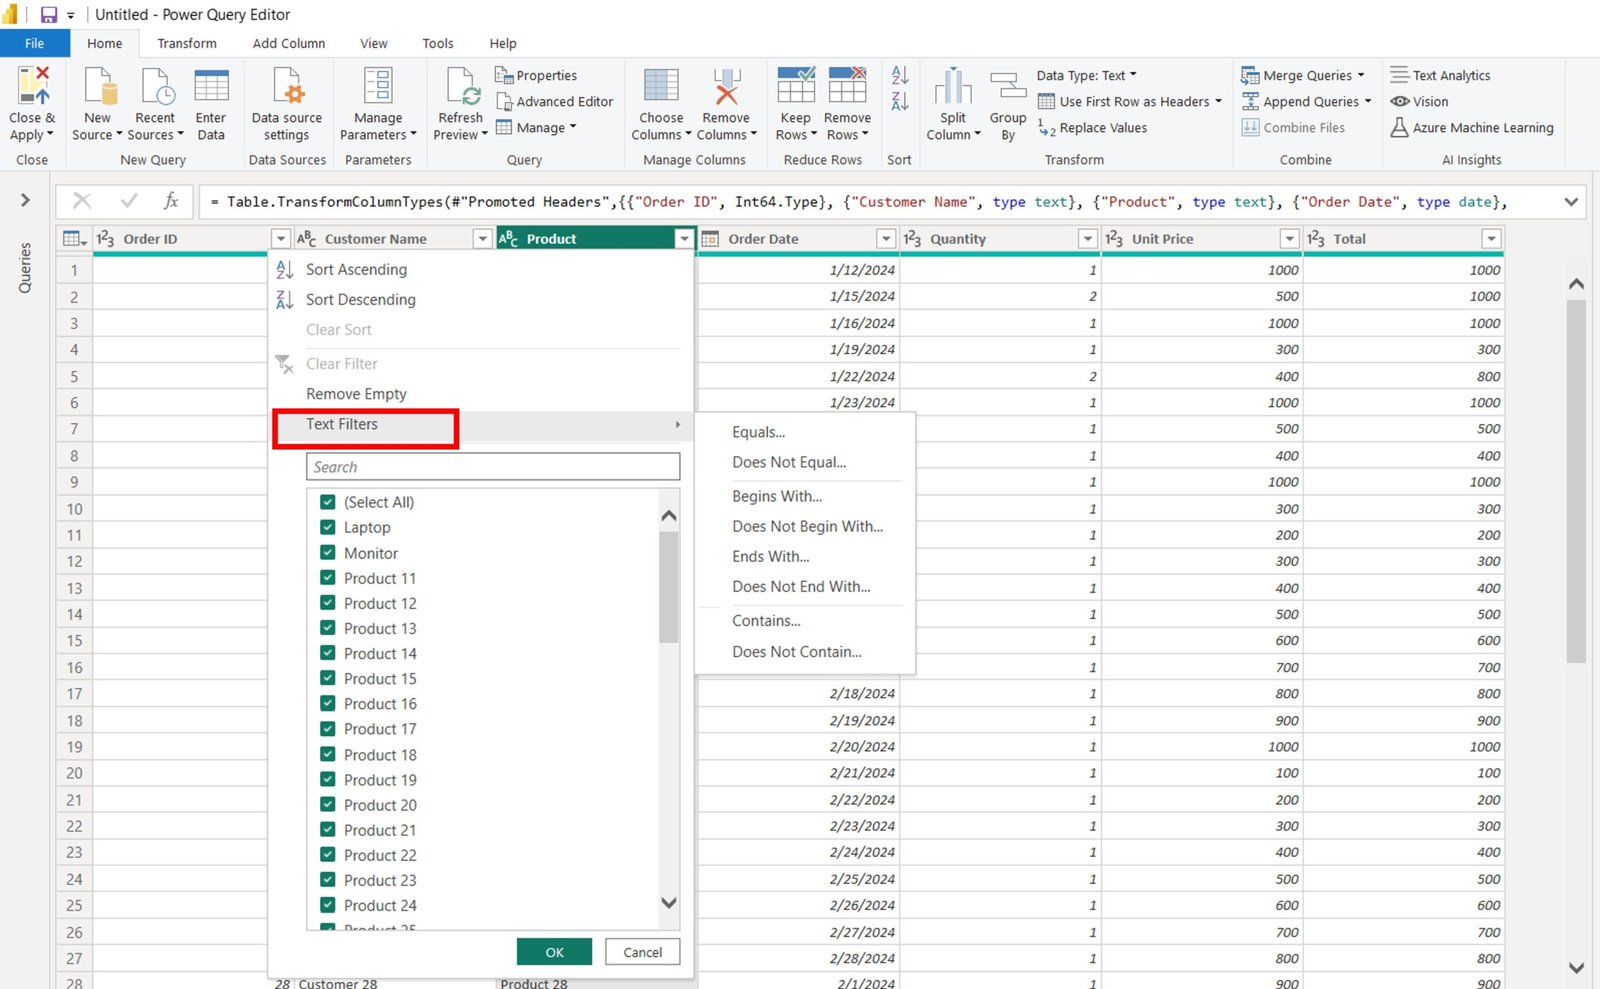
If you’re dealing with text-based columns, such as product names or customer comments, you can filter based on specific text criteria. This gives you flexibility in finding relevant data based on words or patterns.
Steps to Filter by Text Criteria:
- Select the column you want to filter.
- Click the filter icon next to the column header.
- From the dropdown menu, choose Text Filters.
- Pick an option (e.g., Equals, Contains, Begins With, Ends With) and enter the desired text.
- Click OK to apply the filter.
Filtering Rows by Date Criteria
When working with time-sensitive data, such as sales data for a particular month or year, you can filter rows by specific date ranges. Power Query provides various filtering options to help with this.
Steps to Filter by Date:
- Select the column that contains date values.
- Click the filter icon next to the column header.
- Choose Date Filters from the dropdown.
- Select your desired date filter (e.g., Before, After, Between) and input the date range.
- Click OK to apply the filter.

Filtering Rows Based on Numeric Values
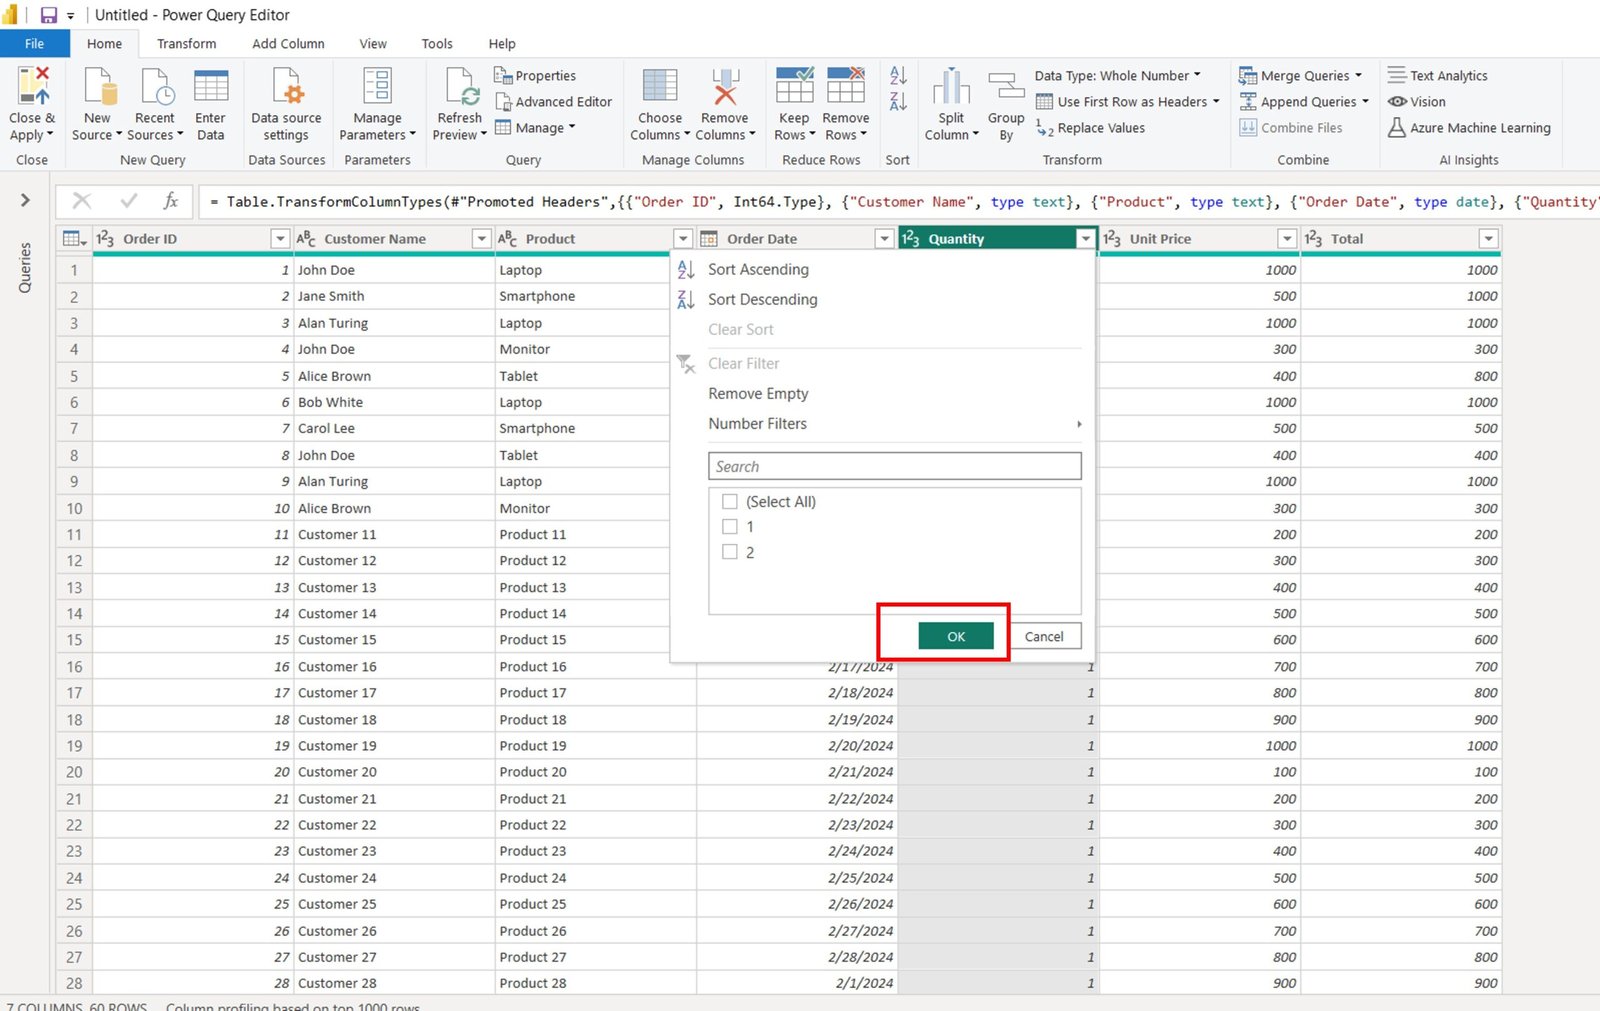
If your dataset contains numeric values (like sales numbers or quantities), you might want to filter based on conditions such as greater than, less than, or between specific values.
Steps to Filter by Numeric Values:
- Select the numeric column you want to filter.
- Click the filter icon next to the column header.
- From the dropdown, choose Number Filters.
- Pick the appropriate numeric condition (e.g., Greater Than, Less Than, Between) and input the values.
- Click OK to apply the filter.

Using Advanced Filtering (Custom Conditions)
Sometimes, you need more complex filtering. Power Query allows you to create custom conditions, combining multiple criteria using logical operators like AND and OR.
Steps to Create Custom Filters:
- Select the column you want to filter.
- Click the filter icon and choose Custom Filter.
- Use logical operators (AND/OR) to combine your conditions. For example, filter for data where the sales amount is greater than 500 AND the product category is “Electronics.”
- Click OK to apply the filter.
Removing Filtered Data (Excluding Specific Rows)
In some cases, you might want to exclude specific rows based on certain conditions, keeping only the rows that meet your filtering criteria.
Steps to Exclude Data:
- Select the column to filter.
- Use the dropdown menu or choose Text Filters, Number Filters, or Date Filters.
- Deselect the values you want to exclude from your dataset.
- Click OK to apply the filter.
Filtering Data Using the Filter Pane
For a more detailed approach, you can use the Filter Pane in Power Query. This feature gives you greater control, allowing you to apply multiple filters across different columns simultaneously.
Steps to Use the Filter Pane:
- Open Power Query Editor and navigate to the View tab.
- Enable the Filter Pane option to open the sidebar.
- In the Filter Pane, apply multiple filters across different columns.
- Click Apply to filter the data based on your chosen conditions.
Sample Dataset for Filtering in Power Query
To practice the filtering techniques outlined above, try using a sample dataset in Power BI. Simply copy and paste this data into an Excel file and import it into Power BI to start experimenting with different filtering methods.

Final Thoughts
Mastering data filtering in Power Query is a key skill for cleaning and analyzing data efficiently in Power BI. By using the methods we’ve discussed—from basic filters to advanced custom conditions—you can easily refine your dataset and focus on what really matters. As you practice with the sample dataset, you’ll get comfortable using different filtering techniques, making it second nature to filter complex datasets.
Visit our YouTube channel to learn step-by-step video tutorials
Youtube.com/@NeotechNavigators