Monitoring financial performance is essential for business growth and sustainability. The Finance KPI Scorecard in Google Sheets is a ready-to-use template that helps finance teams track key financial metrics, analyze trends, and make data-driven decisions.
In this article, we will explain the features, advantages, and best practices of using this finance KPI scorecard.
What Is a Finance KPI Scorecard?
A Finance KPI Scorecard is a visual tool that consolidates financial metrics in one dashboard. It allows finance managers to track key performance indicators (KPIs), monitor performance trends, and evaluate financial health monthly or annually.
With Google Sheets, this scorecard provides flexibility, collaboration, and easy updating of financial data. It’s designed to track multiple KPIs simultaneously and display insights using traffic lights, arrows, and charts.
Key Features of the Finance KPI Scorecard
Click to Buy Finance KPI Scorecard in Google Sheets
The scorecard includes multiple worksheets to provide a comprehensive financial overview:
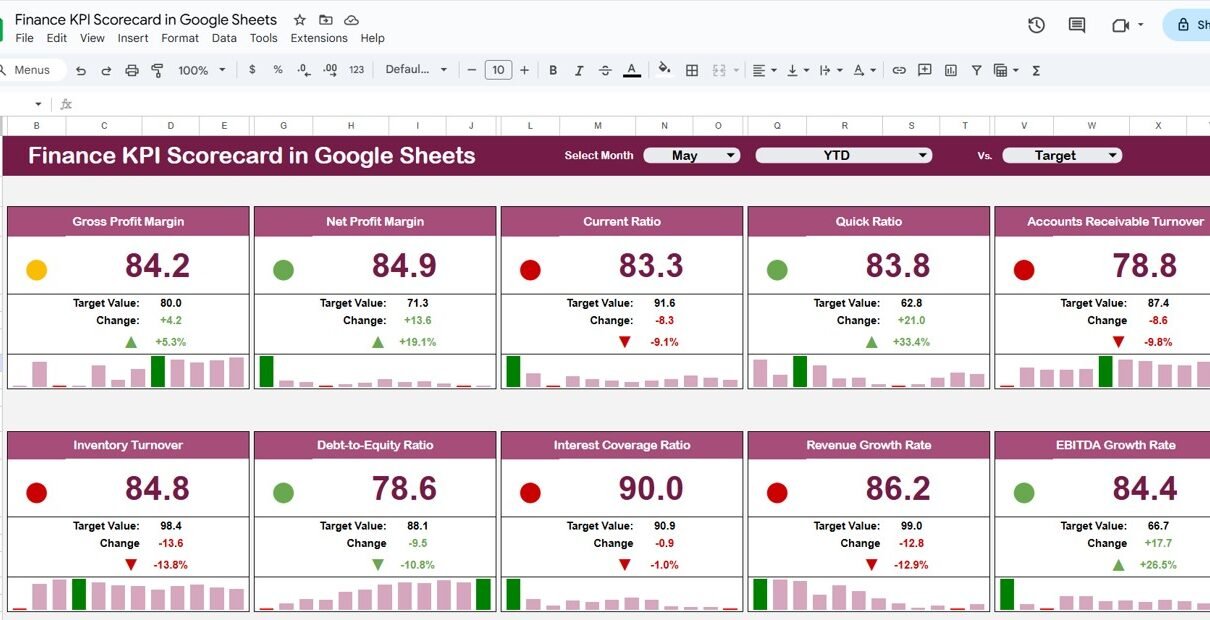
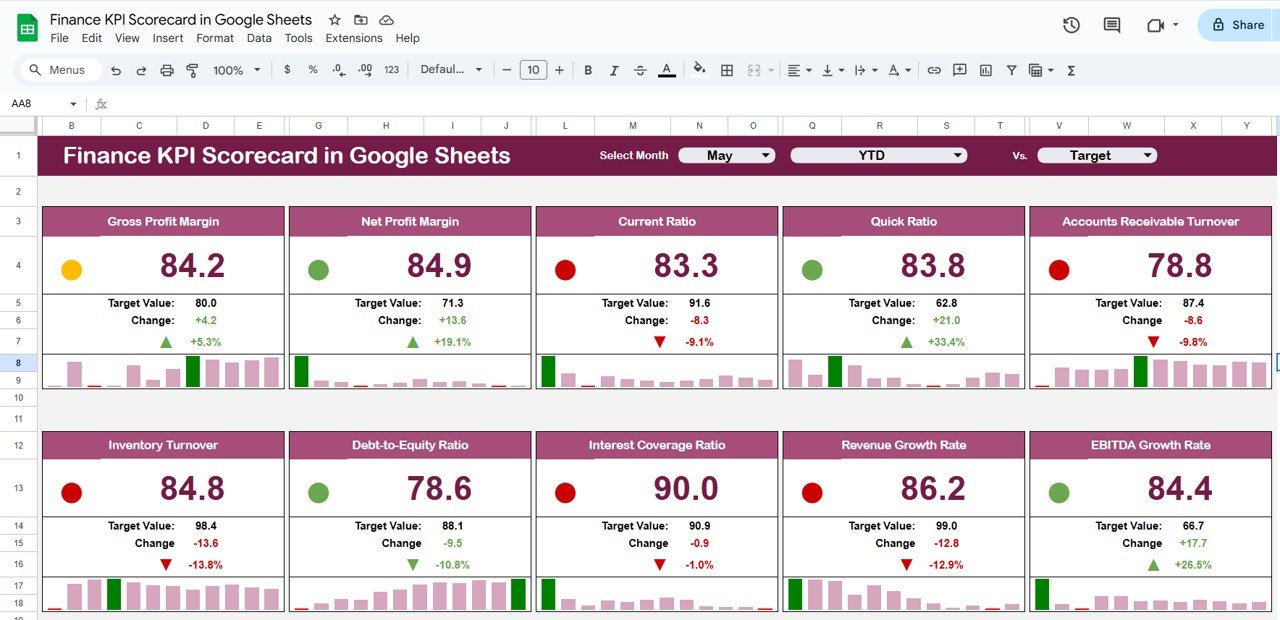
1. Scorecard Overview
The Scorecard displays a monthly snapshot of 10 KPIs:
-
Month Dropdown: Select any month to update all metrics automatically
-
MTD and YTD Views: Toggle between monthly and yearly performance
-
Traffic Lights and Arrows: Visual indicators show percentage changes and performance status
-
Key Metrics: Includes revenue, expenses, profit margins, cash flow, and other financial KPIs
This view helps finance teams quickly understand the current financial performance.
Click to Buy Finance KPI Scorecard in Google Sheets
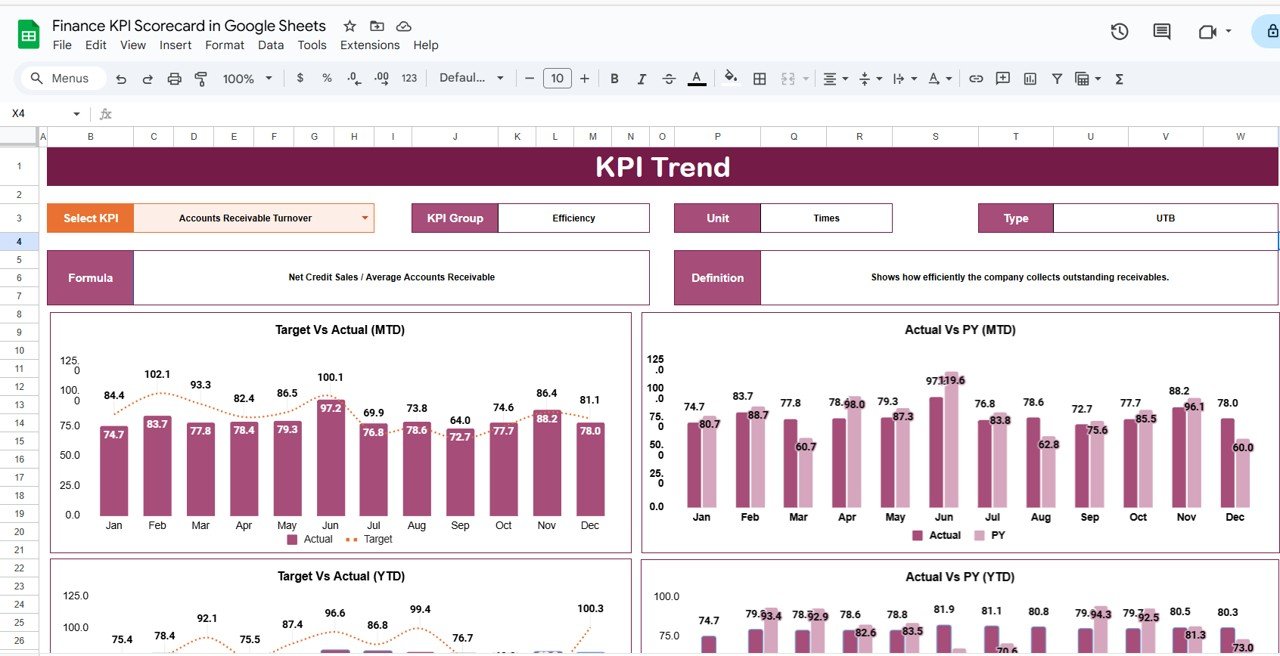
2. Trend Sheet Tab
The Trend Sheet provides a detailed view of individual KPIs over time:
-
KPI Selection Dropdown (Range C3): Select the KPI you want to analyze
-
Displayed Information: KPI Group, Unit, KPI Type (Lower-the-Better / Upper-the-Better)
-
Visual Trends: Charts and graphs track KPI performance over multiple months
-
Analysis: Helps identify trends, seasonality, and potential issues
Click to Buy Finance KPI Scorecard in Google Sheets
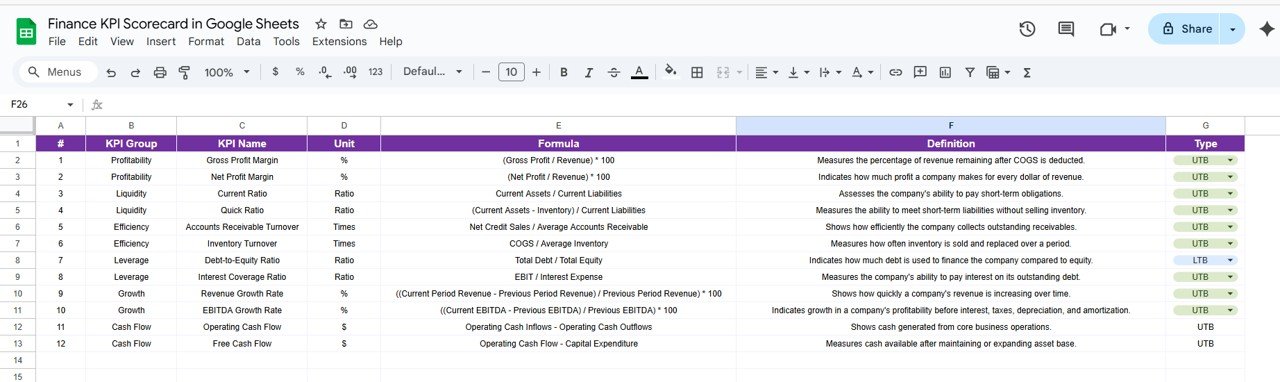
3. KPI Definition Sheet Tab
The KPI Definition Sheet documents all financial KPIs:
-
KPI Name
-
KPI Group
-
Unit of Measure
-
Formula used for calculation
-
KPI Definition
-
KPI Type (Lower-the-Better or Upper-the-Better)
This sheet ensures clarity and consistency when evaluating KPIs.
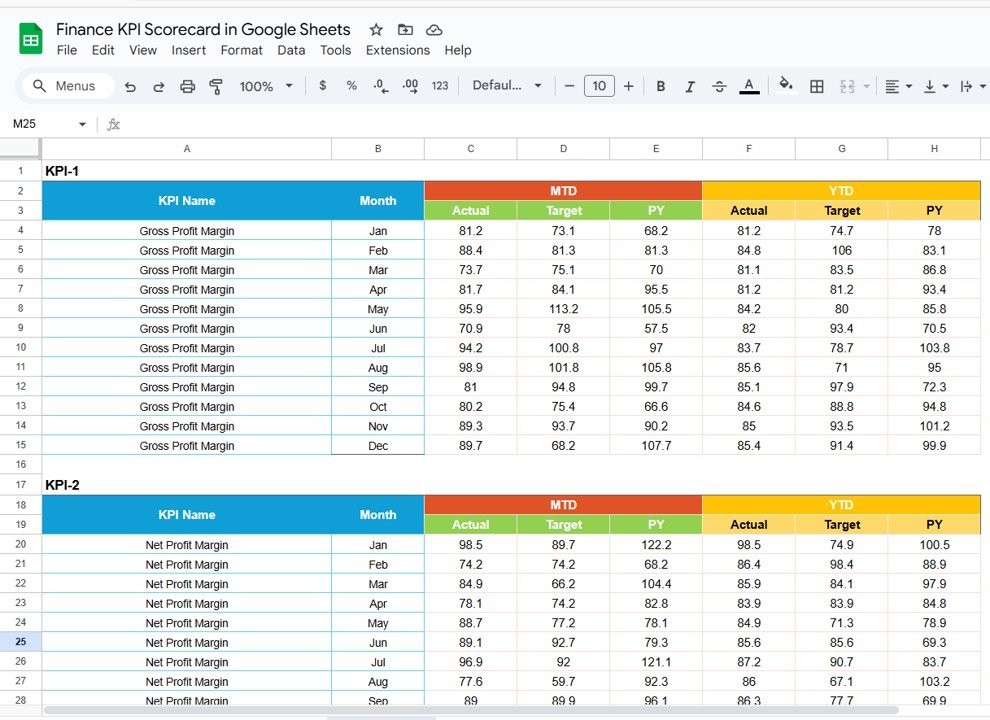
4. Data Input Sheet Tab
-
Enter actual financial data for each KPI
-
Supports both MTD (Month-to-Date) and YTD (Year-to-Date) entries
-
Automatically updates the dashboard metrics and visual indicators
Click to Buy Finance KPI Scorecard in Google Sheets
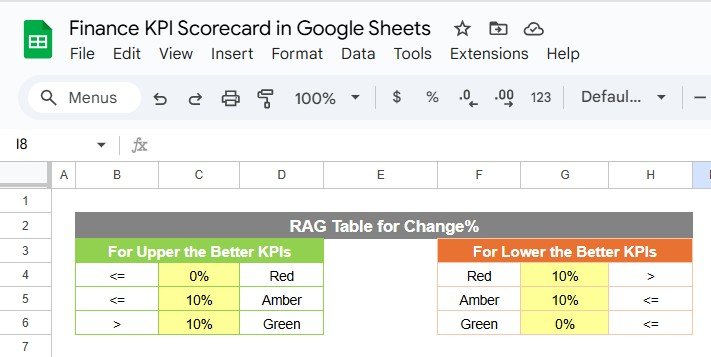
5. Color Settings Sheet Tab
-
Manage traffic light colors for performance visualization
-
Customize up/down arrow colors for MTD and YTD comparisons
-
Helps make the dashboard visually intuitive for quick decision-making
Advantages of Using the Finance KPI Scorecard
-
Centralized Financial Tracking: All KPIs in one sheet for quick reference
-
Real-Time Insights: Automatically updates when new data is entered
-
Trend Analysis: Track monthly and yearly performance to identify trends
-
Visual Indicators: Traffic lights and arrows make performance easy to interpret
-
Data-Driven Decisions: Quickly spot underperforming areas and take corrective action
-
Customizable: Add or remove KPIs, adjust formulas, and change visual settings
Best Practices for Using the Scorecard
Click to Buy Finance KPI Scorecard in Google Sheets
-
Update Data Promptly: Enter financial data regularly for accurate insights
-
Review Monthly and Yearly Trends: Analyze MTD and YTD to identify seasonal patterns
-
Focus on Key Metrics: Prioritize critical KPIs like cash flow, profit margin, and revenue growth
-
Use Conditional Formatting Effectively: Make traffic lights and arrows intuitive for quick interpretation
-
Document KPI Definitions: Ensure all users understand the formulas and KPI types
-
Customize for Your Organization: Adjust the scorecard to match your company’s financial reporting needs
How This Scorecard Helps Finance Teams
-
Track Financial Health: Monitor revenue, expenses, profitability, and cash flow
-
Identify Performance Gaps: Spot KPIs that are underperforming against targets
-
Support Strategic Decisions: Provide executives with clear insights for planning
-
Visualize Trends: Graphs and trend lines make patterns easy to recognize
-
Enhance Reporting: Simplifies internal and external financial reporting
Frequently Asked Questions (FAQs)
Click to Buy Finance KPI Scorecard in Google Sheets
Q1: Can I add more KPIs to this scorecard?
Yes, you can add additional KPIs in the KPI Definition and Data Input sheets to tailor the dashboard to your needs.
Q2: How do MTD and YTD metrics work?
MTD shows monthly performance while YTD aggregates performance for the year to provide a broader view.
Q3: Can the dashboard track multiple departments or business units?
Yes, by adding columns in the Data Input sheet, you can segment KPIs by department or business unit.
Q4: Are the traffic lights and arrows customizable?
Yes, the Color Settings sheet allows you to change colors for performance indicators.
Q5: Can multiple users update this dashboard simultaneously?
Yes, Google Sheets supports collaborative editing in real time.
Conclusion
The Finance KPI Scorecard in Google Sheets is a powerful, ready-to-use tool for monitoring financial performance. With MTD and YTD tracking, traffic lights, trend analysis, and KPI definitions, this dashboard enables finance teams to make informed, data-driven decisions efficiently.
Visit our YouTube channel to learn step-by-step video tutorials
Youtube.com/@NeotechNavigators