Effective fleet management is crucial for ensuring the smooth operation of a company’s transportation and logistics. The Fleet Management KPI Dashboard in Google Sheets is a ready-to-use tool designed to help fleet managers monitor key performance indicators (KPIs) related to fleet performance, vehicle utilization, fuel efficiency, and maintenance. With this dashboard, companies can track their fleet’s performance and make informed decisions to improve operational efficiency.
In this article, we will break down the key features of the Fleet Management KPI Dashboard and explain how it can be used to manage and monitor your fleet’s KPIs effectively.
What is the Fleet Management KPI Dashboard in Google Sheets?
Click to buy Fleet Management KPI Dashboard in Google Sheets
The Fleet Management KPI Dashboard in Google Sheets is a template that tracks essential fleet metrics, helping fleet managers and organizations streamline their operations. It offers an overview of fleet performance, vehicle costs, fuel efficiency, and maintenance, providing real-time insights into how well your fleet is performing. The dashboard allows users to monitor monthly and yearly KPIs and compare them with target values and previous year data.
Key Features of the Fleet Management KPI Dashboard
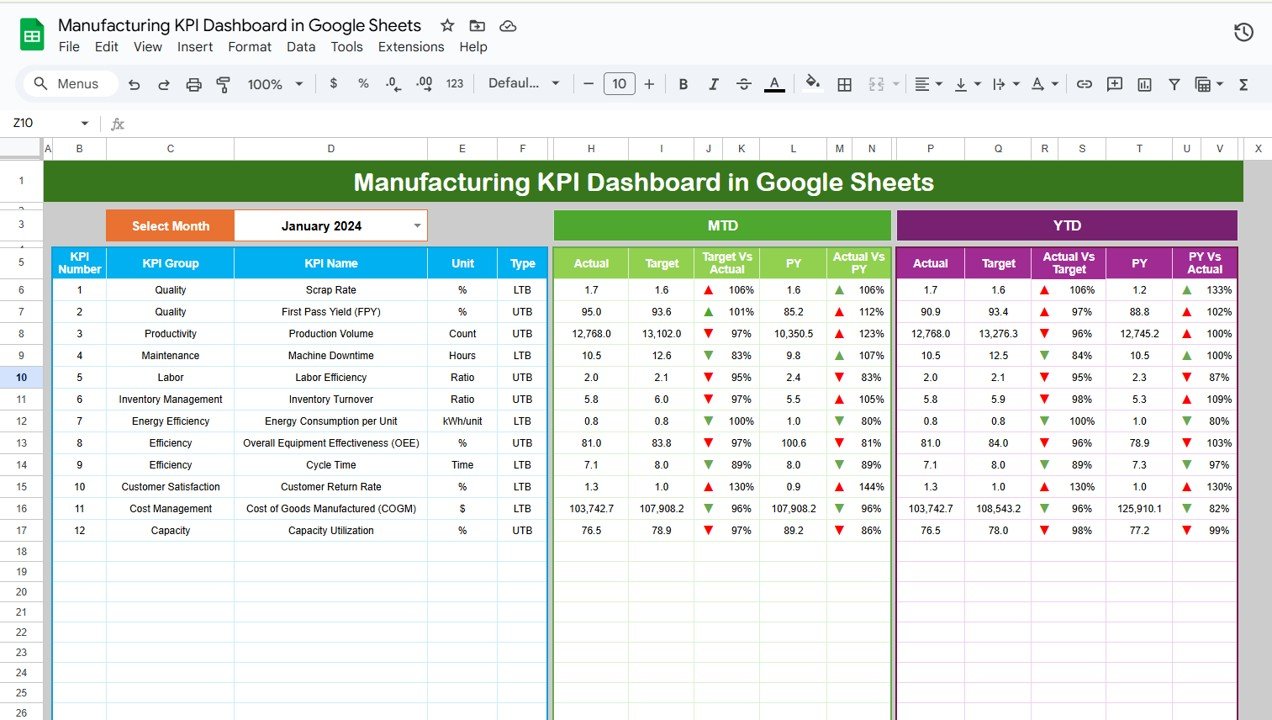
1. Dashboard Sheet Tab
The Dashboard Sheet Tab is the main overview page of the KPI dashboard, displaying charts, cards, and data summaries.
- MTD Actual: Displays the actual value of the metric for the current month.
- Target: Shows the target value for the current month.
- Previous Year Data: Compares the current data with the same month from the previous year.
- Target vs Actual: Uses conditional formatting (up and down arrows) to indicate whether the target was met.
- YTD Actual: Displays the cumulative data for the year to date.

Click to buy Fleet Management KPI Dashboard in Google Sheets
2. KPI Trend Sheet Tab
The KPI Trend Sheet allows users to track the trends of various KPIs over time. You can select the KPI from a dropdown, and the sheet will show historical data for that particular KPI. Key metrics displayed include:
-
KPI Group: The category the KPI belongs to (e.g., fuel efficiency, maintenance).
-
Unit of KPI: The unit of measurement for the KPI (e.g., miles, gallons).
-
Formula for KPI: Explains how the KPI is calculated.
-
Type of KPI: Whether the KPI is “Lower the better” or “Upper the better.”

3. Actual Number Sheet Tab
The Actual Number Sheet is where the actual data for each KPI is entered. It allows users to input data for each KPI monthly and track how the fleet is performing against its targets.
-
YTD and MTD: Users can enter the Year-to-Date (YTD) and Month-to-Date (MTD) values for each KPI.’

Click to buy Fleet Management KPI Dashboard in Google Sheets
4. Target Sheet Tab
The Target Sheet allows you to input the target values for each KPI, setting benchmarks that the fleet is expected to meet each month. These targets help assess whether the fleet is meeting its goals or falling short in areas like fuel efficiency or vehicle uptime.

5. Previous Year Sheet Tab
The Previous Year Sheet is essential for comparing current fleet performance with data from the previous year. This comparison enables you to assess improvements or declines in key areas such as maintenance costs, fuel consumption, and vehicle performance.

Click to buy Fleet Management KPI Dashboard in Google Sheets
6. KPI Definition Sheet Tab
This sheet contains definitions for each KPI used in the dashboard, making it easier to understand the calculations and units associated with each metric. It includes the formula for each KPI and the type (whether “Lower the better” or “Upper the better”), ensuring clarity on how to interpret the data.

Advantages of Using the Fleet Management KPI Dashboard
- Real-Time Monitoring: Track fleet performance in real-time, enabling quick decision-making and identifying areas for improvement.
- Data-Driven Insights: Visual charts and data summaries provide actionable insights into fleet operations.
- Easy Comparison: Compare monthly and yearly data, helping you identify trends and patterns over time.
- Customizable: Adapt the dashboard to fit your specific fleet management needs by adding or removing KPIs.
- Improved Efficiency: By tracking and optimizing KPIs like fuel consumption and vehicle downtime, the dashboard helps reduce costs and improve fleet utilization.
Best Practices for Using the Fleet Management KPI Dashboard
Click to buy Fleet Management KPI Dashboard in Google Sheets
-
Regular Data Updates: Ensure the data is updated regularly to keep track of fleet performance and make timely adjustments.
-
Set Realistic Targets: Input reasonable and achievable target values to provide a clear standard for fleet performance.
-
Track Trends Over Time: Regularly review the KPI Trend Sheet to understand how different metrics change over time and identify any long-term trends.
-
Monitor Driver Performance: Use the Driver Performance KPI to identify areas where individual drivers can improve.
-
Optimize Vehicle Utilization: Use data from the Vehicle Utilization by Department chart to ensure that each vehicle is used efficiently and not underutilized.
Conclusion
The Fleet Management KPI Dashboard in Google Sheets is an essential tool for fleet managers looking to track and optimize fleet performance. With its comprehensive features, customizable KPIs, and real-time data tracking, the dashboard helps improve efficiency, reduce costs, and streamline fleet management processes. Whether you’re managing a small fleet or a large transportation network, this dashboard will help you stay on top of key metrics and ensure the smooth operation of your fleet.
Frequently Asked Questions (FAQs)
Click to buy Fleet Management KPI Dashboard in Google Sheets
1. How do I enter data into the Fleet Management KPI Dashboard?
You can enter data for each KPI in the Actual Number Sheet Tab, which will automatically update the dashboard and charts.
2. Can I customize the dashboard to track additional KPIs?
Yes, the dashboard is fully customizable. You can add new KPIs, change the chart types, and adjust the layout to suit your fleet management needs.
3. How can I compare the performance of my fleet from year to year?
The Previous Year Sheet Tab allows you to compare current fleet data with previous year’s performance, helping you assess improvements or declines in performance.
4. Can I use this dashboard for a fleet of any size?
Yes, the Fleet Management KPI Dashboard can be used for fleets of any size, whether you’re managing a few vehicles or hundreds.
Visit our YouTube channel to learn step-by-step video tutorials
Youtube.com/@NeotechNavigators
Watch the step-by-step video Demo:
Click to buy Fleet Management KPI Dashboard in Google Sheets