The food and beverage industry operates in a fast-moving and highly competitive environment. Businesses must continuously monitor production, sales performance, inventory availability, costs, and profitability. However, many organizations still rely on disconnected spreadsheets and manual reports. As a result, managers struggle to gain real-time insights and make timely decisions.
Therefore, businesses increasingly adopt centralized analytics dashboards. One powerful and practical solution is the Food and Beverage Dashboard in Google Sheets — a ready-to-use interactive reporting system designed to transform operational data into clear business insights.
In this detailed guide, you will learn everything about the Food and Beverage Dashboard in Google Sheets, including its structure, features, benefits, analysis capabilities, best practices, and real-world applications.
What Is a Food and Beverage Dashboard in Google Sheets?
A Food and Beverage Dashboard in Google Sheets is an interactive business intelligence tool that tracks operational and financial performance using charts, KPI cards, filters, and automated calculations.
Instead of reviewing multiple reports separately, decision-makers can analyze all important business metrics from a single dashboard interface.
Typically, the dashboard monitors:
- Production volume
- Sales revenue
- Operational costs
- Profit margins
- Inventory availability
- Regional performance
- Department efficiency
- Product category trends
Because Google Sheets is cloud-based, teams can access data anytime and collaborate in real time.
Why Do Food & Beverage Businesses Need a Dashboard?
Click to Buy Food and Beverage Dashboard in Google Sheets
Food and beverage companies deal with high transaction volumes, fluctuating demand, and tight profit margins. Therefore, real-time performance monitoring becomes essential.
Common Challenges Without a Dashboard
- Data scattered across files
- Slow reporting cycles
- Limited visibility into performance
- Difficulty tracking profitability
- Poor inventory monitoring
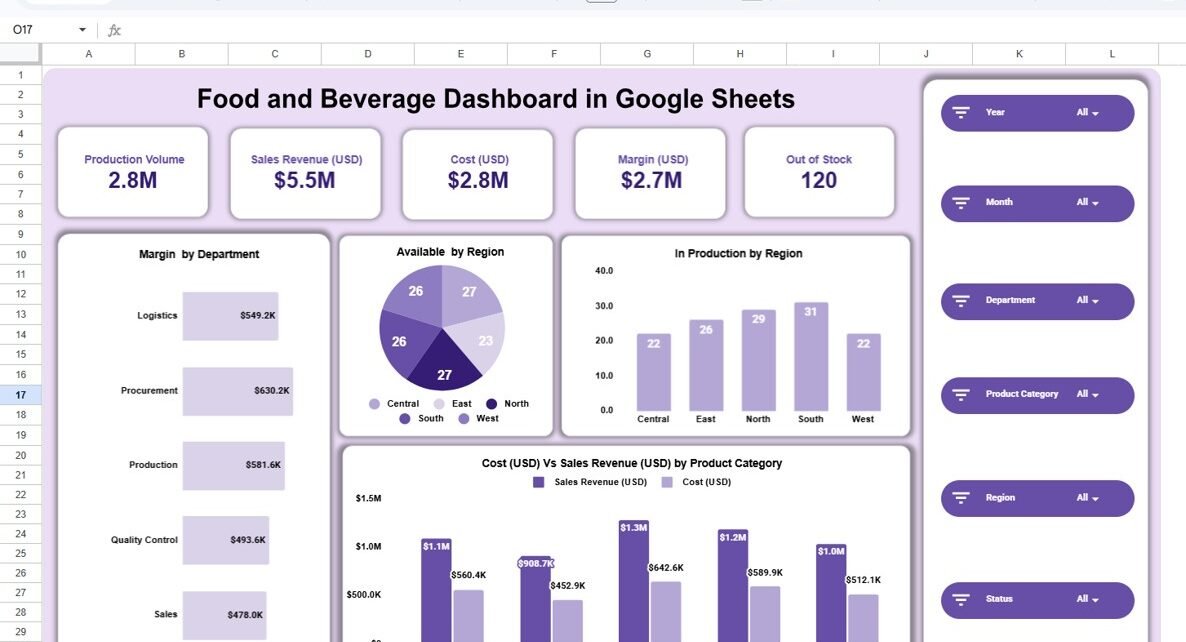
Main Dashboard Overview – Business Performance at a Glance
The main dashboard acts as the executive summary page.
KPI Cards Displayed
- Production Volume: 2.8M units
- Sales Revenue: $5.5M
- Cost: $2.8M
- Margin: $2.7M
- Out of Stock Items: 120
These KPI cards help managers understand business performance instantly.
Visual Insights Included
- Margin by Department
- Availability by Region (Pie Chart)
- Production by Region (Bar Chart)
- Cost vs Sales Revenue by Product Category
Because visuals update automatically through filters, users can analyze performance dynamically.
Interactive Filters (Slicers)
Users can filter dashboard data by:
- Year
- Month
- Department
- Product Category
- Region
- Status
Therefore, analysis becomes flexible and user-driven.

Click to Buy Food and Beverage Dashboard in Google Sheets
Department Analysis – Evaluating Operational Efficiency
The Department Analysis page focuses on operational performance across business units.
Key Charts
- Available Stock by Department
- Production by Department
- Cost Analysis by Department
This page helps managers identify which departments drive efficiency and which require improvement.

Click to Buy Food and Beverage Dashboard in Google Sheets
Product Category Analysis – Understanding Product Performance
The Product Category Analysis page evaluates product-level performance.
Categories Included
- Bakery
- Beverages
- Dairy
- Frozen Foods
- Snacks
Key Metrics Analyzed
- Availability by Category
- Production by Category
- Cost vs Sales Revenue Comparison
This analysis helps businesses understand profitability across product lines.

Click to Buy Food and Beverage Dashboard in Google Sheets
Region Analysis – Geographic Performance Insights
The Region Analysis page highlights performance across geographic markets.
Regions Covered
- Central
- East
- North
- South
- West
Charts Included
- Availability by Region
- Cost vs Sales Revenue by Region
- Production Trend by Region
This enables businesses to compare regional profitability and demand patterns.

Click to Buy Food and Beverage Dashboard in Google Sheets
Monthly Trends Analysis – Tracking Performance Over Time
The Monthly Trends page provides time-based analysis.
Insights Included
- Availability by Month
- Sales Revenue Trends
- Production Trends
Trend charts allow managers to understand seasonality and demand fluctuations.

Click to Buy Food and Beverage Dashboard in Google Sheets
Advantages of Food and Beverage Dashboard in Google Sheets
Real-Time Collaboration
Teams access dashboards simultaneously from anywhere.
Centralized Data Analysis
All performance metrics appear in one system.
Interactive Reporting
Filters allow customized analysis instantly.
Automated Calculations
Reduces manual reporting effort.
Visual Decision-Making
Charts simplify complex data.
Cost-Effective Solution
No expensive BI software required.
Who Should Use This Dashboard?
Click to Buy Food and Beverage Dashboard in Google Sheets
This dashboard benefits multiple roles:
- Restaurant chains
- Food manufacturers
- Beverage companies
- Supply chain managers
- Retail food businesses
- Operations managers
- Business analyst
Common Mistakes to Avoid
-
Tracking too many metrics
-
Ignoring trend analysis
-
Using inconsistent naming conventions
-
Not reviewing filters properly
-
Delayed data updates
Avoiding these mistakes ensures accurate insights.
Why Google Sheets Is Ideal for Business Dashboards?
Click to Buy Food and Beverage Dashboard in Google Sheets
Google Sheets provides powerful advantages:
-
Cloud-based access
-
Real-time collaboration
-
Easy sharing
-
Automatic saving
-
Integration with other tools
Therefore, it becomes an excellent lightweight BI solution.
Conclusion
The Food and Beverage Dashboard in Google Sheets provides a powerful yet simple way to monitor operational and financial performance. By combining KPI cards, interactive charts, and dynamic filters, the dashboard transforms raw business data into actionable insights.
Moreover, organizations gain better visibility, faster decision-making, and improved profitability. Because the dashboard remains easy to use and cloud-enabled, businesses can implement it quickly and scale analytics efficiently.
Ultimately, data-driven food and beverage businesses achieve stronger operational control and sustainable growth.
Frequently Asked Questions (FAQs)
Click to Buy Food and Beverage Dashboard in Google Sheets
What is a Food and Beverage Dashboard in Google Sheets?
It is an interactive dashboard used to analyze production, sales, costs, and inventory performance.
Can beginners use this dashboard?
Yes. The dashboard uses simple filters and automated charts.
Does the dashboard update automatically?
Yes. Charts update when source data changes.
Can I customize categories or regions?
Yes. Users can modify data structure easily.
Is Google Sheets suitable for business analytics?
Yes. It supports real-time collaboration and dynamic reporting.
Visit our YouTube channel to learn step-by-step video tutorials
Youtube.com/@NeotechNavigators
Watch the step-by-step video tutorial: