Franchise businesses operate across multiple locations, teams, and customer groups. Managing performance across stores becomes difficult without a centralized and real-time system. That’s why many organizations use a Franchise Management KPI Dashboard in Google Sheets to monitor revenue, compliance, customer satisfaction, and operational efficiency.
This ready-to-use dashboard provides MTD & YTD tracking, targets, previous year comparison, KPI trends, and detailed analytics for complete franchise management.
In this article, we explain the dashboard structure and provide a complete list of Franchise KPIs with units, formulas, definitions, and KPI type (Upper the Better / Lower the Better).
What Is the Franchise Management KPI Dashboard in Google Sheets?
Click to Buy Franchise Management KPI Dashboard in Google Sheets
The Franchise Management KPI Dashboard is a Google Sheets tool designed to track franchise operations across locations. It helps you analyze:
-
Franchise sales
-
Customer satisfaction
-
Franchisee performance
-
Compliance score
-
Store operating efficiency
-
Profitability
With automated charts, dropdown selections, and structured worksheets, this dashboard makes franchise monitoring fast and simple.
Why Use Google Sheets for Franchise Management?
Google Sheets provides:
-
Cloud access
-
Real-time updates
-
Easy customization
-
Team collaboration
-
No extra software cost
This makes it a perfect solution for multi-location franchise management.
Dashboard Structure and Worksheets
This dashboard contains 6 main worksheet tabs:
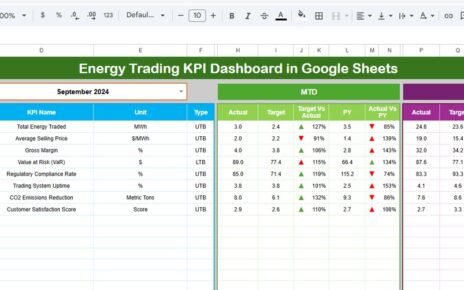
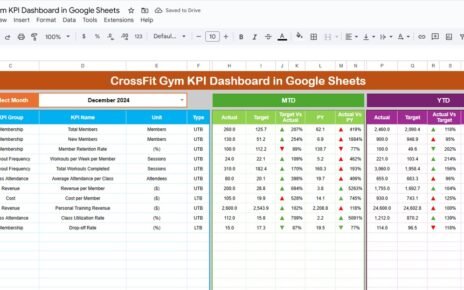
1. Dashboard Sheet Tab
This is the main reporting page.
-
Month selection available in Range D3
-
Dashboard auto-updates based on selected month
-
Displays MTD Actual, Target, Previous Year
-
Displays YTD Actual, Target, Previous Year
-
Highlighting Target vs Actual and PY vs Actual
-
Conditional up/down arrows for easy visual interpretation

Click to Buy Franchise Management KPI Dashboard in Google Sheets
2. KPI Trend Sheet Tab
This sheet displays KPI insights where you can pick the KPI from Range C3.
The sheet shows:
-
KPI Group
-
KPI Unit
-
KPI Type (Upper/Lower the Better)
-
KPI Formula
-
KPI Definition
-
Trend chart for selected KPI

Click to Buy Franchise Management KPI Dashboard in Google Sheets
3. Actual Number Sheet Tab
Here you enter:
-
MTD Actual values
-
YTD Actual values
Change the reporting month in Range E1 by entering the first month of the year.

4. Target Sheet Tab
Enter:
-
MTD Target values
-
YTD Target values
for each KPI.

Click to Buy Franchise Management KPI Dashboard in Google Sheets
5. Previous Year Sheet Tab
Enter the same KPIs for the previous year to use in YTD and MTD comparison.

6. KPI Definition Sheet Tab
This sheet stores:
-
KPI Name
-
KPI Group
-
Unit
-
Formula
-
KPI Definition
-
Upper/Lower the Better classification

Click to Buy Franchise Management KPI Dashboard in Google Sheets
Advantages of Using This Franchise KPI Dashboard
-
All KPIs in one dashboard
-
MTD and YTD insights with auto-updated metrics
-
Comparison with targets and previous year
-
Better visibility across franchise operations
-
Simple to update and share across teams
-
Trend analysis to identify improvement areas
Opportunities for Improvement
Click to Buy Franchise Management KPI Dashboard in Google Sheets
-
Add franchise-wise detailed scorecard
-
Automate data input with Google Forms
-
Integrate with POS systems using Apps Script
-
Add predictive analytics for sales forecasting
-
Build heatmaps for location-based performance
Best Practices for Using the Dashboard
-
Update Actual, Target & Previous Year tabs monthly
-
Review KPI Trend sheet weekly
-
Set realistic targets for each franchise KPIs
-
Train users to interpret KPI formulas correctly
-
Use conditional formatting to highlight underperformance
Conclusion
Click to Buy Franchise Management KPI Dashboard in Google Sheets
The Franchise Management KPI Dashboard in Google Sheets is a powerful tool for tracking franchise sales, profitability, operations, customer satisfaction, and compliance. It allows franchisors and franchisees to make informed decisions based on real-time data.
With clear MTD/YTD tracking, target comparison, and KPI trends, this dashboard simplifies franchise performance management and supports long-term growth.
Frequently Asked Questions (FAQs)
Click to Buy Franchise Management KPI Dashboard in Google Sheets
1. What KPIs does the dashboard track?
Revenue, customer satisfaction, compliance, operations, inventory, and franchisee support metrics.
2. Can I change KPIs?
Yes, you can add, remove, or edit KPIs in the KPI Definition sheet.
3. Does the dashboard auto-update on month selection?
Yes, selecting the month in D3 updates the entire dashboard instantly.
4. Is it beginner-friendly?
Yes, it requires no technical skills—just basic Google Sheets usage.
5. Can multiple users collaborate?
Yes, Google Sheets supports real-time multi-user collaboration.
Visit our YouTube channel to learn step-by-step video tutorials
Youtube.com/@NeotechNavigators
Click to Buy Franchise Management KPI Dashboard in Google Sheets