Google Sheets is an incredibly powerful tool for data analysis, and one of its practical applications is automating grade distribution. Assigning grades based on scores can be tedious, but with the right formula, you can simplify the entire process. This article will walk you through Grade Distribution in Google Sheets, including step-by-step instructions, practical examples, and best practices to ensure efficiency and accuracy.
Understanding Grade Distribution in Google Sheets
Grade distribution involves categorizing students or individuals based on their scores into predefined ranges or categories. For example:
- A: Scores ≥ 90
- B: Scores between 75 and 89
- C: Scores between 50 and 74
- D: Scores below 50
Using the IF function, you can automate this process in Google Sheets, saving time and ensuring consistency.
Data Setup for Grade Distribution
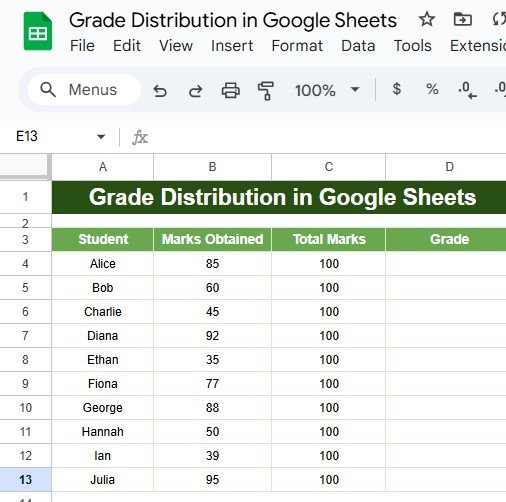
Let’s start with an example dataset:
This table includes Marks Obtained for each student and their corresponding Total Marks. We will use a formula to assign grades automatically.
Formula for Grade Distribution
To calculate grades, we use a nested IF formula in Google Sheets. Here’s the formula:
=IF(B2>=90,”A”,IF(B2>=75,”B”,IF(B2>=50,”C”,”D”)))
Explanation of the Formula:
- B2 >= 90: If the marks in column B are 90 or more, assign grade “A”.
- B2 >= 75: If the marks are between 75 and 89, assign grade “B”.
- B2 >= 50: If the marks are between 50 and 74, assign grade “C”.
- Default (“D”): If none of the above conditions are true (marks below 50), assign grade “D”.
This formula evaluates each condition in sequence, returning the first grade that matches the criteria.
Step-by-Step Guide to Apply the Formula
Open Your Google Sheet
Open the dataset in Google Sheets.
Select the Target Column
Choose the column where you want the grades to appear (e.g., column D for “Grade”).
Insert the Formula
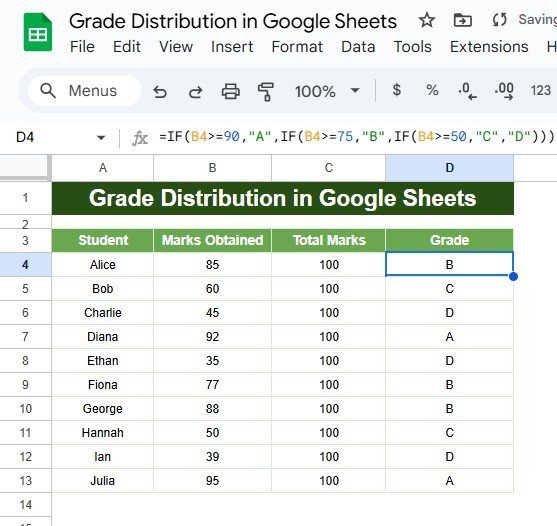
In the first row of the target column (e.g., D2), insert the formula:
=IF(B2>=90,”A”,IF(B2>=75,”B”,IF(B2>=50,”C”,”D”)))
Copy the Formula
Drag the formula down to fill the remaining rows.
Review the Output
The grades will now appear automatically based on the marks obtained.
Example Output
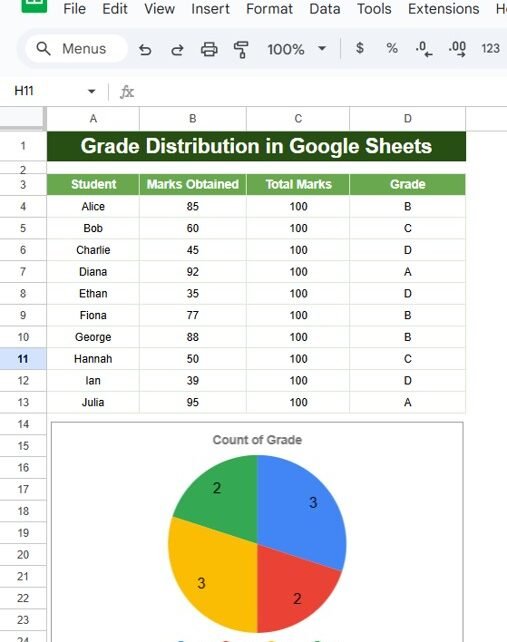
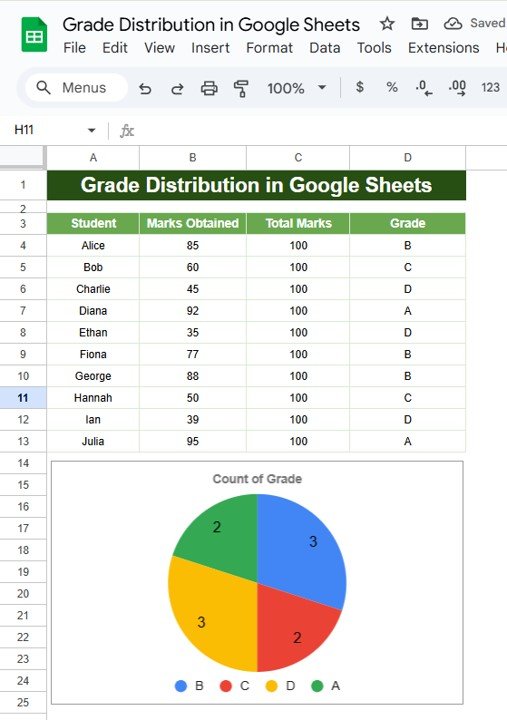
After applying the formula, your dataset will look like this:
Advantages of Automating Grade Distribution
- Saves Time: Automate repetitive tasks like grading large datasets.
- Reduces Errors: Eliminate human errors in grade calculation.
- Improves Consistency: Ensures uniform criteria for all grades.
- Customizable: Adapt the formula to different grading systems effortlessly.
Opportunities for Improvement in Grade Distribution
- Handling Errors Gracefully:
Use the IFERROR function to manage blank cells or invalid inputs.
=IFERROR(IF(B2>=90,”A”,IF(B2>=75,”B”,IF(B2>=50,”C”,”D”))), “Invalid Input”)
- Adding Dynamic Ranges:
Store grade thresholds in separate cells to make the formula more flexible. For example:
Threshold for “A” in F1
Threshold for “B” in F2
Formula:
=IF(B2>=F1,”A”,IF(B2>=F2,”B”,IF(B2>=50,”C”,”D”)))
- Visual Representation:
Use conditional formatting to highlight grades or marks based on thresholds.
Best Practices for Grade Distribution in Google Sheets
- Keep Formulas Simple:
Avoid overly complex nested formulas. Break them into helper columns if needed.
- Document Thresholds:
Clearly define grading criteria in the sheet for transparency.
- Test with Sample Data:
Validate the formula on a small dataset to ensure accuracy.
- Use Conditional Formatting:
Highlight students who scored below passing marks for quick identification.
- Additional Tips for Grade Distribution
Integrating Other Functions:
Combine COUNTIF to count the number of students in each grade.
=COUNTIF(D2:D11,”A”)
- Automating Reporting:
Use pivot tables to summarize grade distributions by class, subject, or term.
- Exporting Reports:
Export the graded sheet as a PDF for easy sharing.
Conclusion
Grade distribution in Google Sheets becomes a breeze with the IF function. By following the steps and examples shared in this article, you can automate the process, save time, and enhance accuracy. Whether you’re a teacher managing student grades or an analyst handling employee performance data, this technique is invaluable.
Visit our YouTube channel to learn step-by-step video tutorials
Youtube.com/@NeotechNavigators
View this post on Instagram
