Managing a grocery store requires tracking multiple performance indicators, including sales, inventory, customer satisfaction, and operational efficiency. The Grocery Store KPI Dashboard in Google Sheets provides a ready-to-use solution that consolidates all essential KPIs in one interactive dashboard, helping store managers make data-driven decisions.
In this article, we will explain the features, benefits, best practices, and examples of KPIs included in this dashboard.
What Is a Grocery Store KPI Dashbord?
A Grocery Store KPI Dashboard is a visual tool built in Google Sheets that tracks and monitors key performance indicators critical for store operations. This dashboard allows managers to:
-
Monitor monthly and yearly performance (MTD and YTD)
-
Compare actual performance with targets and previous year data
-
Identify trends and areas needing improvement
-
Optimize store operations and maximize profitability
With interactive charts, cards, and trend analysis, managers gain a clear understanding of how the store is performing at a glance.
Key Features of the Grocery Store KPI Dashboard
Click to Buy Grocery Store KPI Dashboard in Google Sheets
This dashboard contains six worksheets, each designed to provide unique insights:
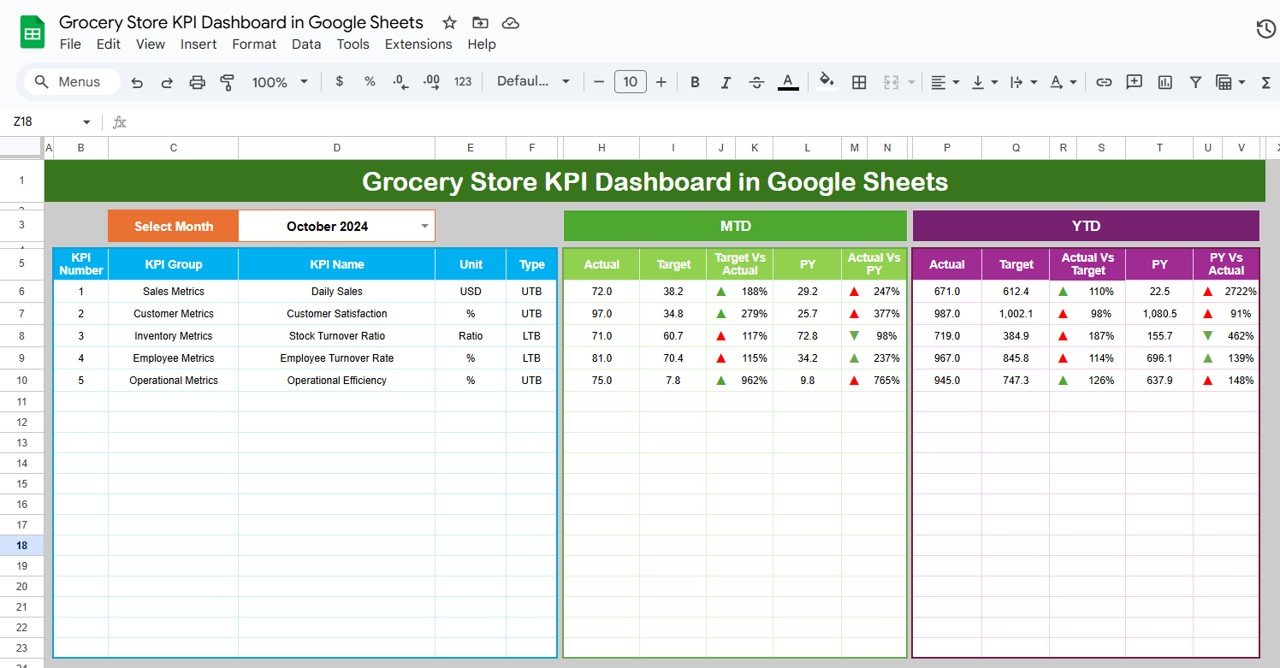
1. Dashboard Sheet Tab
The Dashboard Sheet serves as the main interface for monitoring all KPIs:
Features include:
-
Month Selection (Range D3): Automatically updates all dashboard metrics for the selected month
-
MTD Metrics: Displays Actual, Target, Previous Year data with conditional formatting for Target vs Actual and PY vs Actual
-
YTD Metrics: Tracks cumulative performance for the year, with conditional formatting for quick analysis
This sheet allows managers to evaluate store performance efficiently and visually.
Click to Buy Grocery Store KPI Dashboard in Google Sheets
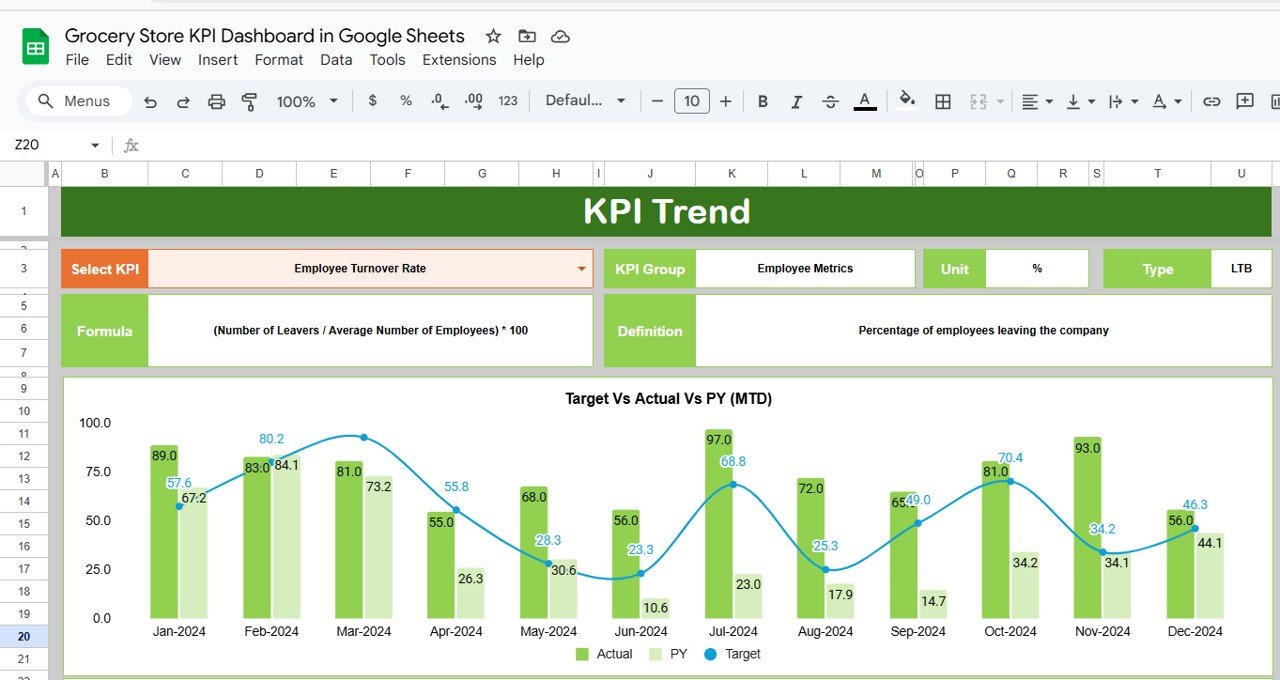
2. KPI Trend Sheet Tab
The KPI Trend Sheet provides detailed insights for individual KPIs:
-
Select a KPI using the dropdown in Range C3
-
Displays KPI Group, Unit, Type (Lower-the-Better or Upper-the-Better)
-
Shows the KPI formula and definition
-
Allows trend tracking over months for both MTD and YTD performance
This sheet helps identify underperforming areas and monitor improvement over time.
Click to Buy Grocery Store KPI Dashboard in Google Sheets
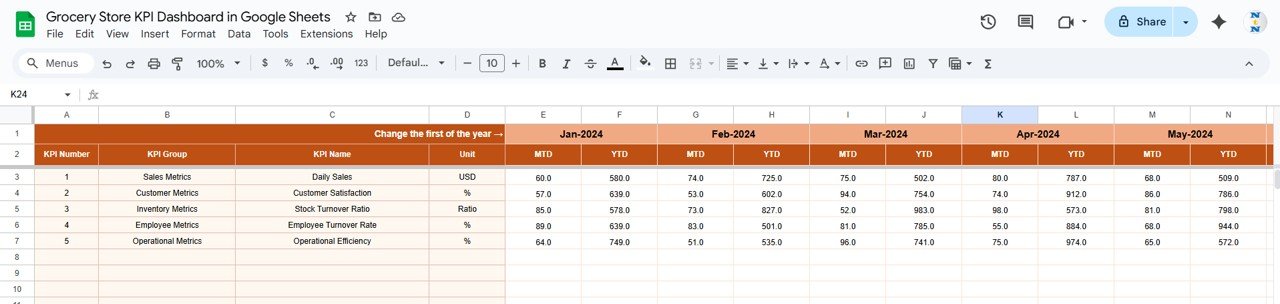
3. Actual Numbers Sheet Tab
-
Enter actual values for MTD and YTD KPIs
-
Change the first month of the year in Range E1 to update the calculations dynamically
Accurate data entry ensures that the dashboard reflects real performance metrics.
4. Target Sheet Tab
-
Enter monthly and yearly target values for all KPIs
-
Supports comparison with actual values to measure goal achievement
Clear targets help managers evaluate performance and make data-driven decisions.
Click to Buy Grocery Store KPI Dashboard in Google Sheets
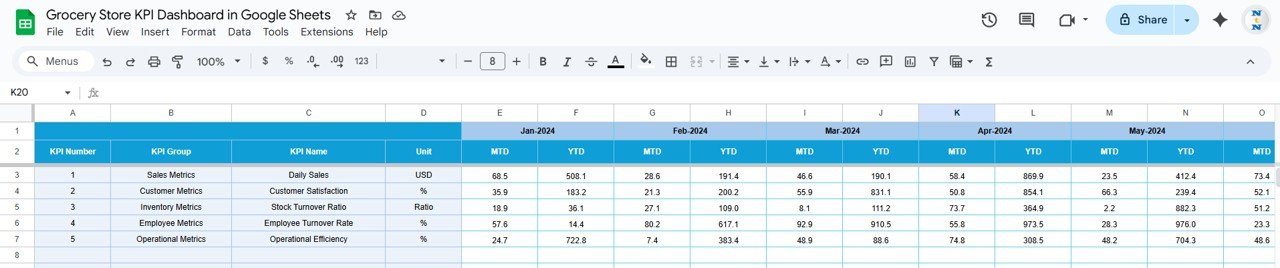
5. Previous Year Numbers Sheet Tab
-
Input last year’s KPI values to enable year-over-year comparisons
-
Helps assess growth, seasonality, and performance trends
Year-over-year analysis provides context for performance evaluation and strategy planning.

6. KPI Definition Sheet Tab
-
Document all KPIs including Name, Group, Unit, Formula, Definition, and Type (Upper-the-Better or Lower-the-Better)
-
Ensures consistency and clarity in measuring and analyzing KPIs
This sheet acts as a reference for all KPI calculations and definitions within the dashboard.

Click to Buy Grocery Store KPI Dashboard in Google Sheets
Examples of KPIs in a Grocery Store
Some essential KPIs included in this dashboard:
-
Total Sales ($): Revenue generated per month
-
Average Basket Value ($): Average customer spend per transaction
-
Inventory Turnover Rate: Frequency of inventory sold and replaced
-
Customer Footfall: Number of customers visiting the store
-
Stock-Outs: Number of times products are out of stock (Lower-the-Better)
-
Employee Performance Score: Employee contribution to sales and efficiency
-
Sales per Category: Revenue breakdown by product category
Each KPI is defined with:
-
Unit of Measurement (e.g., $, %, count)
-
Formula (e.g., Total Sales ÷ Number of Transactions)
-
Type: UTB (Upper-the-Better) or LTB (Lower-the-Better)
Advantages of Using the Grocery Store KPI Dashboard
-
Centralized Data: Track all KPIs in one Google Sheet
-
Real-Time Insights: Interactive dashboards update as data is entered
-
Trend Analysis: MTD, YTD, and year-over-year comparisons
-
Identify Underperforming Areas: Quickly spot low-performing categories or departments
-
Optimize Store Operations: Adjust stock levels, staffing, and marketing strategies based on KPI insights
-
Easy to Use: Google Sheets interface allows collaboration and accessibility
Best Practices for Using the Dashboard
Click to Buy Grocery Store KPI Dashboard in Google Sheets
-
Update Actual Numbers Regularly: Enter MTD and YTD data to maintain accuracy
-
Track Key Categories Separately: Monitor high-value categories to optimize inventory
-
Use Conditional Formatting: Highlight KPIs that are under target or overperforming
-
Analyze Trends: Compare month-over-month and year-over-year data
-
Focus on Actionable KPIs: Prioritize metrics that directly impact revenue and customer satisfaction
-
Maintain KPI Definitions: Ensure all employees understand how each KPI is measured
How This Dashboard Helps Grocery Store Managers
-
Improve Decision-Making: Quickly identify trends and areas for improvement
-
Optimize Inventory: Track stock-outs and turnover rates to prevent losses
-
Monitor Employee Performance: Measure productivity and contribution to sales
-
Increase Profitability: Use insights to adjust pricing, promotions, and product assortment
-
Enhance Customer Experience: Track footfall and basket value to improve service
Frequently Asked Questions (FAQs)
Click to Buy Grocery Store KPI Dashboard in Google Sheets
Q1: Can I add new KPIs to the dashboard?
Yes, the dashboard is fully customizable. Add KPIs in the KPI Definition sheet and update the Actual, Target, and Previous Year sheets accordingly.
Q2: How often should the data be updated?
Monthly updates are recommended for MTD and YTD metrics to track performance effectively.
Q3: Can this dashboard track multiple store locations?
Yes, you can include location as a filter in the Actual Numbers and Data sheets for multi-store tracking.
Q4: How do I analyze trends over time?
Use the KPI Trend sheet to monitor MTD, YTD, and year-over-year trends for each KPI.
Q5: Is this dashboard suitable for small and large grocery stores?
Absolutely. It is scalable and can handle a few KPIs or hundreds of records efficiently.
Conclusion
The Grocery Store KPI Dashboard in Google Sheets is a comprehensive, ready-to-use tool that allows store managers to monitor sales, inventory, and operational performance. By tracking key KPIs, managers can make data-driven decisions, optimize store operations, and improve customer satisfaction and profitability.
Visit our YouTube channel to learn step-by-step video tutorials
Youtube.com/@NeotechNavigators