Tracking performance in the home appliances industry requires clear visibility into sales, operations, targets, and trends. When KPI data is scattered across multiple spreadsheets, it becomes difficult to evaluate performance, compare targets, and take timely actions. That is exactly where the Home Appliances KPI Dashboard in Google Sheets becomes a powerful, ready-to-use solution.Home Appliances KPI Dashboard in Google Sheets
In this article, we explain how the Home Appliances KPI Dashboard in Google Sheets works, its sheet-wise structure, key features, and how it helps sales, operations, and management teams monitor performance efficiently.Home Appliances KPI Dashboard in Google Sheets
What Is a Home Appliances KPI Dashboard in Google Sheets?
Click to Buy Home Appliances KPI Dashboard in Google Sheets
A Home Appliances KPI Dashboard in Google Sheets is a structured KPI scorecard designed to track and analyze key performance indicators related to home appliance sales and operations. It provides a centralized view of performance using:
-
Monthly and yearly KPI tracking
-
Target vs Actual comparison
-
Previous Year vs Current Year analysis
-
Visual indicators such as traffic lights and up/down arrows
Because it is built in Google Sheets, the dashboard is cloud-based, easy to share, and simple to customize.
Why Use Google Sheets for Home Appliances KPI Tracking?
Google Sheets is an ideal platform for KPI dashboards because it combines flexibility, accessibility, and automation.
Key Benefits
-
Cloud-based and accessible from anywhere
-
Easy collaboration across teams
-
No additional BI software cost
-
Fully customizable KPI logic
-
Automatic recalculation with dropdowns
This dashboard leverages these advantages while providing a professional KPI framework.
Key Features of the Home Appliances KPI Dashboard
Click to Buy Home Appliances KPI Dashboard in Google Sheets
This dashboard includes all KPIs with Unit, aggregation formula, definition, and KPI type (Lower the Better or Upper the Better).
Highlights
-
Month Selector (Cell D3) – Select any month to view monthly KPI performance
-
Dynamic KPI Refresh – All numbers update automatically when the month changes
-
Traffic Light Indicators – Instantly identify good, average, and poor performance
-
Up & Down Arrows – Show percentage change vs target and previous year
-
MTD & YTD Views – Switch between Month-to-Date and Year-to-Date performance
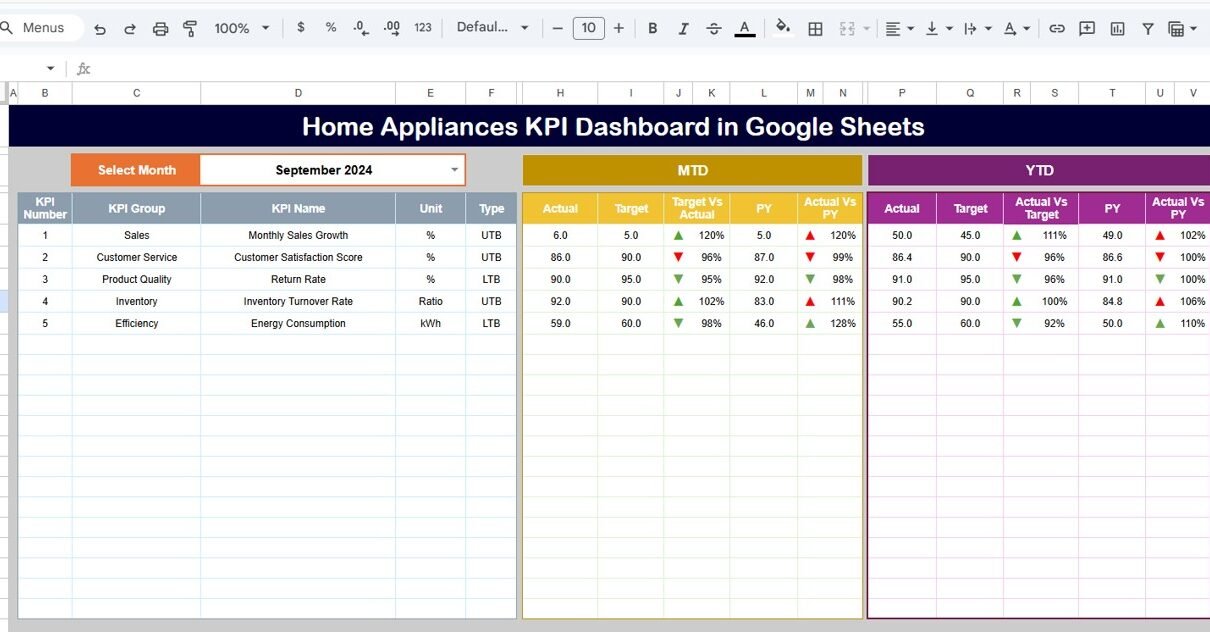
Dashboard Sheet Tab (Main Sheet)
The Dashboard Sheet is the primary view of the KPI system.
What This Sheet Shows
-
KPI Name
-
MTD Actual, Target, and Previous Year values
-
Target vs Actual variance (%)
-
Previous Year vs Actual variance (%)
-
YTD Actual, Target, and Previous Year values
-
Conditional formatting with arrows and traffic lights
This sheet is ideal for leadership reviews and quick performance assessment.

Click to Buy Home Appliances KPI Dashboard in Google Sheets
KPI Trend Sheet Tab
The KPI Trend Sheet allows detailed analysis of individual KPIs.
How It Works
-
Select a KPI name from the dropdown available in Range C3
Automatically displays:
- KPI Group
- Unit of KPI
- KPI Type (Lower the Better / Upper the Better)
- KPI Formula
- KPI Definition
- Monthly trend values
This helps teams understand how each KPI behaves over time.

Click to Buy Home Appliances KPI Dashboard in Google Sheets
Actual Number Sheet Tab
The Actual Number Sheet is used to input real performance data.
Key Inputs
-
Enter MTD and YTD actual values for each KPI
-
Change the month using Range E1
-
Only the first month of the year needs to be defined in E1
Once data is entered, all dashboards and trends update automatically.

Click to Buy Home Appliances KPI Dashboard in Google Sheets
Target Sheet Tab
The Target Sheet defines performance goals.
What You Enter Here
-
Monthly (MTD) target values
-
Yearly (YTD) target values
-
Targets for each KPI
This ensures consistent benchmarking across months and years.

Click to Buy Home Appliances KPI Dashboard in Google Sheets
Previous Year Number Sheet Tab
The Previous Year Sheet stores last year’s performance data.
Purpose
-
Enables Year-over-Year (YoY) comparison
-
Drives PY vs Actual variance calculations
-
Helps identify growth or decline trends
Data entry follows the same structure as current year values.

Click to Buy Home Appliances KPI Dashboard in Google Sheets
KPI Definition Sheet Tab
The KPI Definition Sheet is the backbone of the dashboard.
Information Maintained
-
KPI Name
-
KPI Group (Sales, Operations, Finance, Supply Chain, etc.)
-
Unit (%, Units, Revenue, Count, Days)
-
KPI Formula
-
KPI Definition
-
KPI Type (Lower/Upper the Better)
This sheet ensures transparency, consistency, and audit readiness.

Click to Buy Home Appliances KPI Dashboard in Google Sheets
Advantages of Home Appliances KPI Dashboard in Google Sheets
-
Centralized KPI monitoring
-
Real-time target vs actual tracking
-
Clear YoY performance comparison
-
Visual indicators for quick decisions
-
Easy to customize and scale
-
No technical or BI expertise required
Opportunities for Improvement
Click to Buy Home Appliances KPI Dashboard in Google Sheets
-
Connect with Google Forms for automated data capture
-
Add product-wise or brand-wise KPI analysis
-
Include region or channel-level breakdowns
-
Automate reminders for monthly data updates
Best Practices for Using This KPI Dashboard
-
Finalize KPI definitions before deployment
-
Update actual numbers monthly without delay
-
Review red and amber KPIs in review meetings
-
Use YTD view for strategic decisions
-
Maintain accurate previous year data
Who Should Use This Dashboard?
Click to Buy Home Appliances KPI Dashboard in Google Sheets
This dashboard is ideal for:
-
Home Appliance Manufacturers
-
Sales & Operations Teams
-
Retail & Distribution Managers
-
Business Analysts
-
Senior Management Teams
Any organization involved in home appliance sales and operations can benefit from this KPI framework.
Final Thoughts
The Home Appliances KPI Dashboard in Google Sheets converts complex performance data into a clear, visual, and actionable scorecard. With dynamic month selection, MTD/YTD analysis, and built-in KPI definitions, it enables faster decisions and better performance management.
Visit our YouTube channel to learn step-by-step video tutorials
Youtube.com/@NeotechNavigators
Watch the step-by-step video tutorial: