Do you want a simple and effective way to Sales Performance in Google Sheets? Well, you’re in the right place! In this guide, we’ll walk you through setting up a Sales Performance Tracker in Google Sheets using a real-life example. Whether you’re a small business owner, a manager, or just looking to stay organized, this tracker will help you monitor your team’s sales quickly and efficiently.
Why Use a Sales Performance Tracker?
First, let’s talk about why a sales performance tracker is so important. Tracking sales isn’t just about knowing who made the most sales. It’s about understanding how your team is doing overall. Are they meeting their targets? Who needs more support? By keeping an eye on this, you can make smarter business decisions. Plus, using Google Sheets is convenient because you can update it anytime, anywhere.
Now, let’s move on to the fun part—setting up the tracker!
Setting Up the Example Data
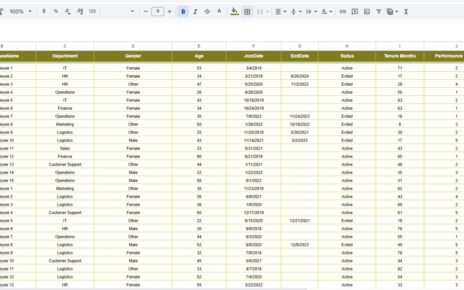
We’re going to use a small set of data for this example, and it’s very easy to follow. The data is in columns A3 to F13 and includes:
Performance Status
This gives us all the information we need to start tracking performance. Now, we just need to add a couple of formulas to make everything work. Let’s see how it’s done!
Simple Formulas to Track Sales Performance
Now, let’s talk about the magic of Google Sheets—formulas! Don’t worry if you’re not an expert. I’ll break it down for you. We’ll use two basic formulas to help you calculate sales performance.
Step 1: Calculate the Percentage of Sales Achieved
First, we’ll figure out what percentage of the sales target has been reached. Here’s the formula:
=D4/C4*100
This formula divides the sales achieved (D4) by the target sales (C4) and multiplies the result by 100. This way, you get a percentage that shows how close each employee is to their target.
Step 2: Check If the Target Was Met
Next, we’ll use an IF statement to see if the employee met their target. Here’s the formula:
=IF(E4>=100,"Met Target", "Below Target")
This formula checks whether the percentage in E4 is 100% or more. If it is, the formula will return “Met Target.” If it’s less than 100%, it will say “Below Target.”
How Do These Formulas Work?
Let’s quickly go over how these formulas work together:
Formula 1: =D4/C4*100 calculates the percentage of sales achieved by dividing actual sales by target sales and multiplying by 100. This gives us a clear picture of progress.
Formula 2: =IF(E4>=100,”Met Target”,”Below Target”) checks if the percentage is equal to or greater than 100%. If it is, the employee has met their target. If not, they haven’t.
The Output – What You’ll See
Once you enter these formulas into your Google Sheet, the tracker will automatically tell you how each employee is performing. You’ll see whether they’ve met their sales target or not, based on the percentage calculated. It’ll look something like this:
Pretty straightforward, right? Now you’ll have a clear view of your team’s performance in just a few simple steps!
Why This Tracker Is Incredibly Helpful
So, why should you start using this Sales Performance Tracker in Google Sheets right away? Well, here are a few reasons why:
- Real-Time Updates: Anytime you update the data, the formulas will automatically recalculate the percentages and show whether targets are met.
- Easily Customizable:🔧 You can add more employees, adjust the targets, or tweak the formulas to fit your specific needs.
- Instant Insights: With just a glance, you’ll know who’s performing well and who might need a little push.
Ready to Build Your Own Sales Tracker?
And that’s it! You now know how to create your very own Sales Performance Tracker in Google Sheets. It’s a super useful tool that helps you stay organized and keep track of your team’s progress. Plus, it’s really easy to update whenever new sales come in.
Visit our YouTube channel to learn step-by-step video tutorials
Youtube.com/@NeotechNavigators
View this post on Instagram