In today’s data-driven world, Human Resources (HR) departments must monitor key performance indicators (KPIs) to measure their effectiveness and drive better decision-making. One of the most powerful ways to track HR metrics is through a customizable HR KPI Dashboard in Google Sheets. This dashboard not only provides a centralized location for tracking critical HR metrics but also enables HR teams to make informed, data-driven decisions.
In this article, we will delve into the essential features of an HR KPI Dashboard in Google Sheets. We will list all the KPIs, including their units, formulas for aggregation, and definitions. Additionally, we’ll explore whether a “higher” or “lower” value is better for each KPI, the advantages of using such a dashboard, opportunities for improvement, and best practices for HR departments to follow.
What Is an HR KPI Dashboard?
An HR KPI Dashboard is a visual representation of key HR metrics, enabling HR professionals to assess and analyze the performance of human resources over time. By centralizing important metrics, HR teams can monitor employee performance, recruitment processes, engagement levels, retention rates, and other vital aspects.
Using Google Sheets to manage your HR KPI Dashboard offers several advantages, including real-time collaboration, cost-effectiveness, and the ability to easily customize and share the dashboard with team members.
Click to buy HR KPI Dashboard in Google Sheets
Key Features of the HR KPI Dashboard in Google Sheets
The HR KPI Dashboard template is a versatile tool consisting of six distinct worksheets, each dedicated to specific elements of KPI tracking. Here’s a closer look at each:
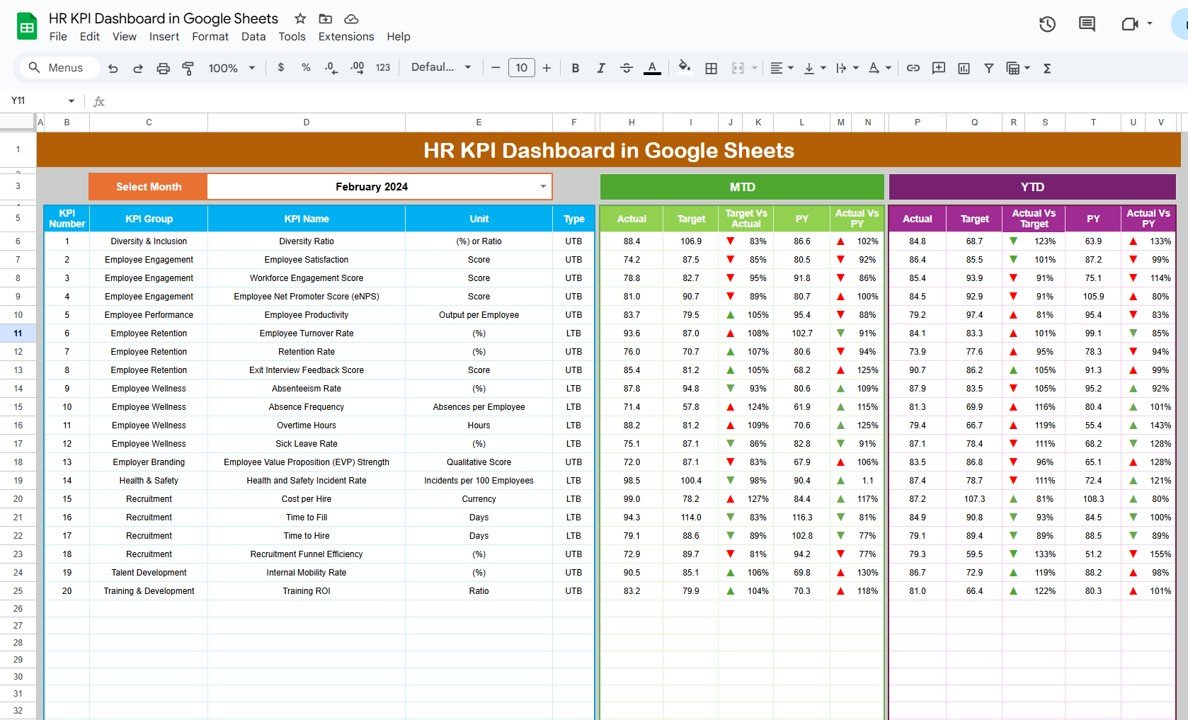
Dashboard Sheet Tab
The Dashboard Sheet is the heart of your KPI Dashboard. Here, you can track both Month-to-Date (MTD) and Year-to-Date (YTD) performance, comparing Actual vs. Target and Previous Year (PY) vs. Actual. The dashboard uses drop-down menus to select the month, allowing you to see how each KPI performs throughout the year. Additionally, the dashboard uses conditional formatting (up/down arrows) to provide a visual cue for quick analysis.
Click to buy HR KPI Dashboard in Google Sheets
KPI Trend Sheet Tab
In this sheet, you can select individual KPIs from a drop-down list. The KPI Group, Unit of Measurement, KPI Type (Lower is Better/Upper is Better), Formula, and Definition are all displayed to give you a deeper understanding of each KPI.

Click to buy HR KPI Dashboard in Google Sheets
Actual Numbers Sheet Tab
This tab allows you to input the actual performance data for both YTD and MTD for any given month. The month can be changed in the drop-down menu at the top, and the data for all KPIs will update accordingly.

Click to buy HR KPI Dashboard in Google Sheets
Target Sheet Tab
In this tab, you can input the target values for each KPI. The data is separated into MTD and YTD, ensuring you track performance against your goals.

Click to buy HR KPI Dashboard in Google Sheets
Previous Year Numbers Sheet Tab
Here, you input the actual data from the previous year. This helps compare current performance against past results, providing valuable insights into progress and areas needing improvement.

Click to buy HR KPI Dashboard in Google Sheets
KPI Definition Sheet Tab
This sheet provides an in-depth description of each KPI. For each metric, you can add the KPI Name, Group, Unit, Formula, and Definition, ensuring clarity and consistency when sharing the dashboard with others.

Click to buy HR KPI Dashboard in Google Sheets
Advantages of Using an HR KPI Dashboard in Google Sheets
An HR KPI Dashboard in Google Sheets offers multiple advantages:
- Real-Time Collaboration: Multiple team members can access and update the dashboard simultaneously, fostering collaboration and transparency.
- Customization: The dashboard is fully customizable, allowing HR teams to tailor the KPIs and layout to suit their specific needs.
- Cost-Effective: Since Google Sheets is free, HR departments can create and maintain the dashboard without additional software costs.
- Ease of Use: With drop-down menus, conditional formatting, and automatic updates, the dashboard is user-friendly and easy to navigate.
- Centralized Data: HR teams can consolidate all key HR data in one place, providing a single source of truth for better decision-making.
Click to buy HR KPI Dashboard in Google Sheets
Opportunities for Improvement in HR KPI Dashboards
Despite the many benefits, there are several opportunities to improve the HR KPI Dashboard in Google Sheets:
- Automation: Use Google Apps Script to automate the data entry process, reducing the risk of errors.
- Advanced Visualizations: Incorporate more advanced charts (e.g., heatmaps, gauges) to present data in more engaging ways.
- Predictive Analytics: Leverage historical data to forecast trends, such as future turnover rates or hiring needs.
- Mobile Accessibility: Ensure the dashboard is optimized for mobile viewing, enabling HR professionals to access key data on the go.
- Integration with HR Software: Integrate the Google Sheets dashboard with other HR software tools (e.g., applicant tracking systems or payroll software) for seamless data flow.
Best Practices for an HR KPI Dashboard in Google Sheets
To maximize the effectiveness of your HR KPI Dashboard, follow these best practices:
- Regular Data Updates: Ensure that all data is updated regularly, either manually or automatically, to reflect real-time performance.
- Keep It Simple: Avoid cluttering the dashboard with unnecessary data. Focus on the most important KPIs that align with your HR goals.
- Use Conditional Formatting: Make use of color-coding or arrows (up/down) to make the data visually appealing and easy to interpret at a glance.
- Limit Access: Control access to the dashboard to protect sensitive HR data, allowing only authorized personnel to make changes.
- Monitor Trends: Regularly analyze trends in your KPIs to spot potential issues or opportunities for improvement.
Click to buy HR KPI Dashboard in Google Sheets
Conclusion
An HR KPI Dashboard in Google Sheets is a valuable tool for tracking and analyzing HR performance. It consolidates essential metrics, such as employee turnover, recruitment effectiveness, and training success, all in one easy-to-use platform. With its real-time collaboration features, customization options, and cost-effectiveness, Google Sheets is an excellent choice for HR teams seeking to monitor their KPIs efficiently.
By following the best practices outlined above and continually refining the dashboard, HR departments can enhance their decision-making and drive improved business outcomes.
Frequently Asked Questions with Answers
1. What is an HR KPI Dashboard?
An HR KPI Dashboard is a tool used to monitor and visualize key performance indicators related to human resources. It helps HR teams track metrics like employee turnover, training effectiveness, and recruitment efficiency.
2. How do I create an HR KPI Dashboard in Google Sheets?
To create an HR KPI Dashboard in Google Sheets, start by creating different sheets for your KPIs, actual numbers, targets, and definitions. Use drop-down menus, formulas, and conditional formatting to make the dashboard interactive and visually appealing.
3. What are the most important HR KPIs to track?
Key HR KPIs include employee turnover rate, training effectiveness, time to hire, cost per hire, absenteeism rate, and employee satisfaction.
4. Can the HR KPI Dashboard be customized for my company?
Yes, the HR KPI Dashboard in Google Sheets is highly customizable. You can modify KPIs, units, targets, and formulas to suit the specific needs of your organization.
5. Is it difficult to use Google Sheets for an HR KPI Dashboard?
Not at all! Google Sheets is user-friendly, and with the right template, HR teams can easily update and track their KPIs. Plus, it’s free, making it an accessible solution for all companies.
Visit our YouTube channel to learn step-by-step video tutorials
Youtube.com/@NeotechNavigators
Click to buy HR KPI Dashboard in Google Sheets
Watch the step-by-step video Demo: