Humanitarian aid organizations play a critical role in delivering support to communities in need. Tracking the performance of these aid initiatives is essential to ensure that resources are allocated efficiently, goals are met, and the impact is maximized. The Humanitarian Aid KPI Dashboard in Google Sheets is an essential tool for measuring the effectiveness of aid programs and improving operational efficiency.
In this article, we will explore the Humanitarian Aid KPI Dashboard in Google Sheets, its key features, and how it can help humanitarian organizations track critical performance metrics in real-time.
What is the Humanitarian Aid KPI Dashboard in Google Sheets?
The Humanitarian Aid KPI Dashboard in Google Sheets is a dynamic tool designed to help humanitarian aid organizations monitor and optimize key performance indicators (KPIs) that measure the effectiveness of their operations. Whether tracking donations, volunteer hours, distribution effectiveness, or aid reach, this dashboard provides actionable insights into the performance of aid programs.
The dashboard consists of six worksheets, each focused on different KPIs, and includes various visualization options such as cards, graphs, and trend analyses. These features allow organizations to track both real-time performance and historical trends.
Key Features of the Humanitarian Aid KPI Dashboard in Google Sheets
This dashboard provides a comprehensive overview of humanitarian aid performance, with six key worksheets designed to track various KPIs. Below are the key features:
1. Dashboard Sheet Tab
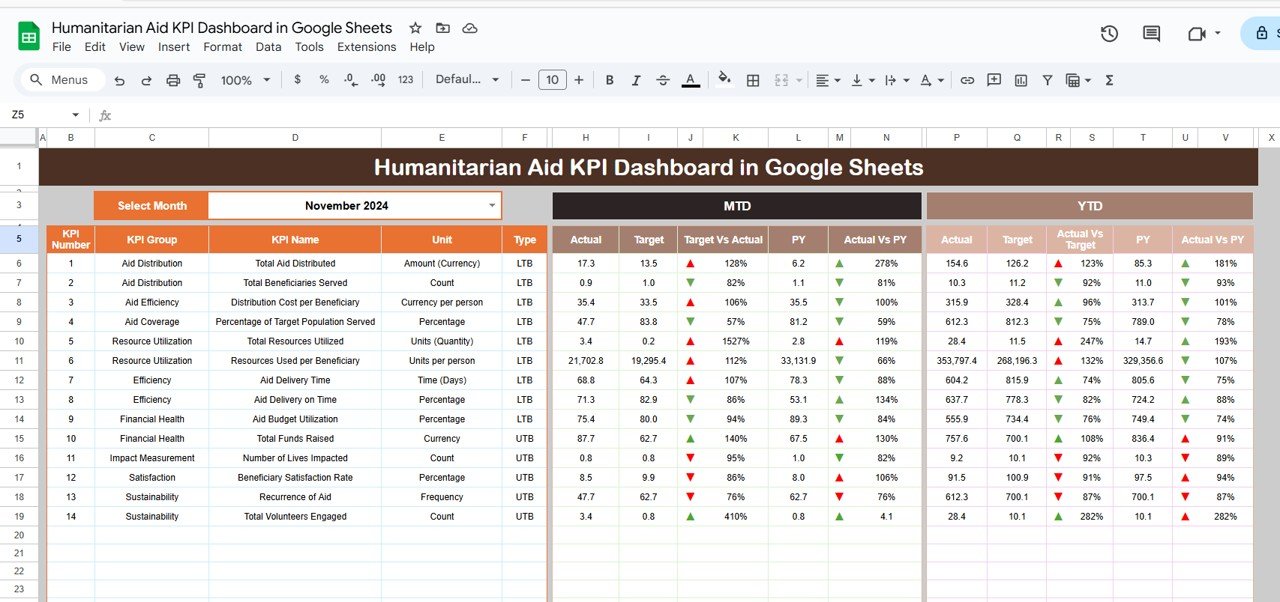
The Dashboard Sheet is the main sheet of the template, offering a high-level view of all key performance indicators. Key features include:
MTD (Month-to-Date) and YTD (Year-to-Date) Metrics:
- MTD Actual: Displays the actual data for the current month.
- MTD Target: Shows the target values for the current month.
- PY vs Actual: Compares the current month’s data with the same period from the previous year (PY).
- YTD Actual: Cumulative data for the year.
- YTD Target vs Actual: Comparison of the YTD target with actual performance.
- Conditional Formatting: Arrows (up or down) show whether the performance is above or below the target and PY data.
Click to buy Humanitarian Aid KPI Dashboard in Google Sheets
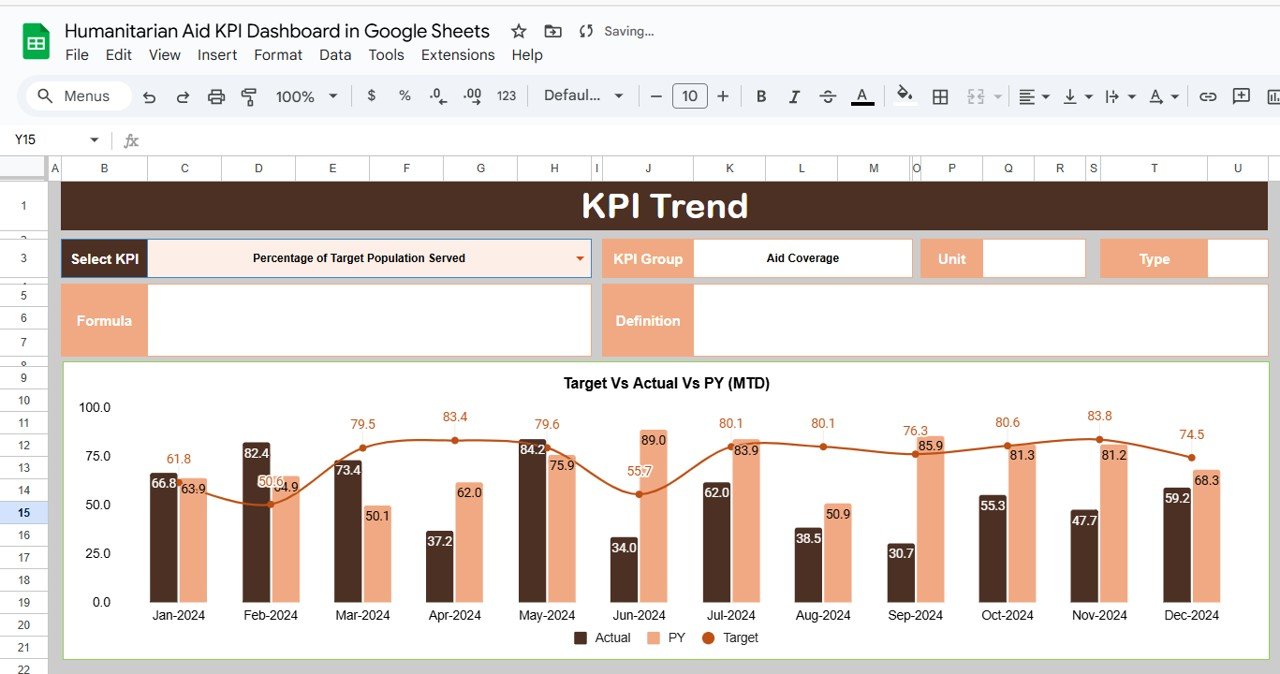
2. KPI Trend Sheet Tab
The KPI Trend Sheet allows you to track each KPI over time, identifying trends and performance changes across different periods.
KPI Selection Dropdown:
In C3, you can select a KPI, and the sheet will display:
- KPI Group: The category of the KPI (e.g., donations, volunteer efforts, distribution).
- Unit of KPI: The unit of measurement for the KPI (e.g., dollars, percentage, number of volunteers).
- Type of KPI: Whether the KPI is “Lower the Better” or “Upper the Better.”
- Formula of KPI: How each KPI is calculated.
- KPI Definition: An explanation of what each KPI measures and how it supports humanitarian aid efforts.
Click to buy Humanitarian Aid KPI Dashboard in Google Sheets
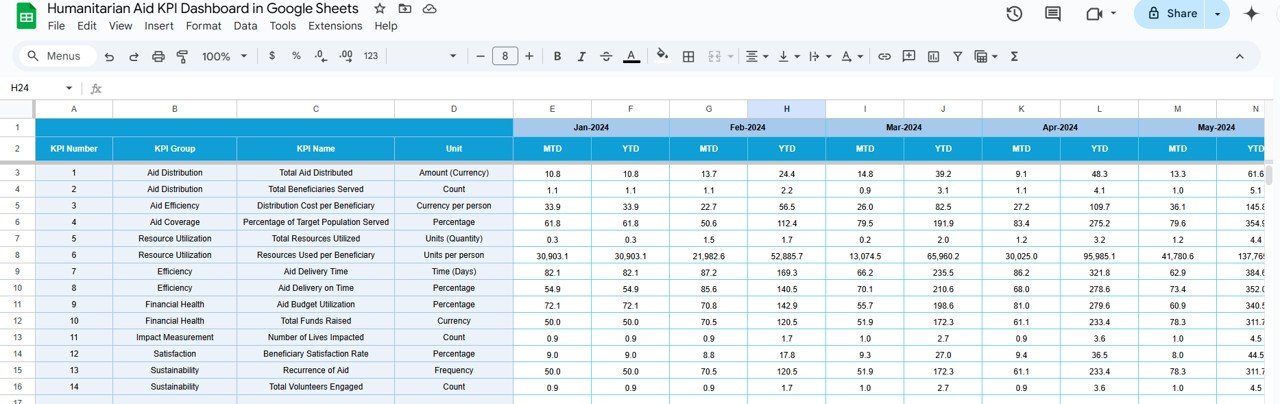
3. Actual Number Sheet Tab
The Actual Number Sheet is where you input actual performance data for MTD and YTD. This sheet allows the dashboard to update automatically with the latest data.
-
Data Entry:
Enter the actual data for each KPI for a selected month (indicated in E1). The dashboard will automatically update with the latest performance metrics.
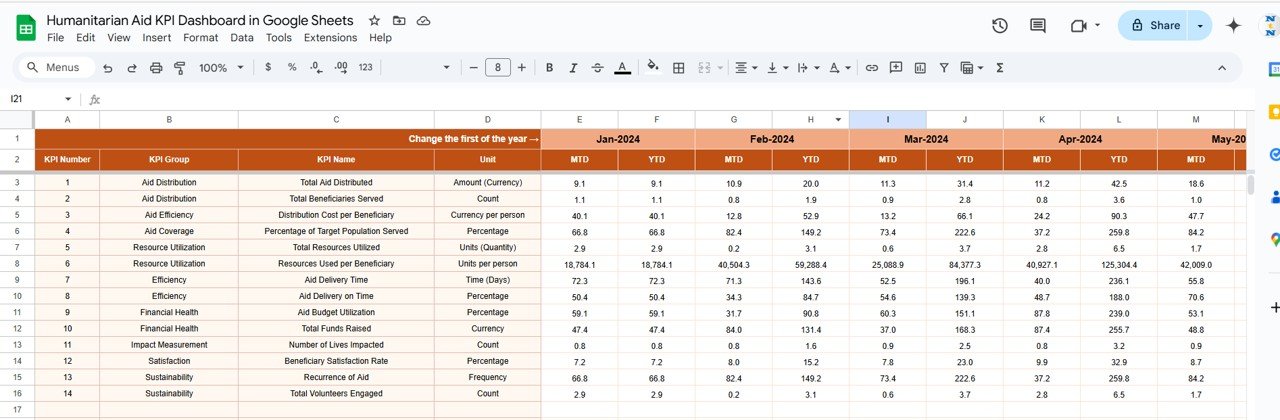
4. Target Sheet Tab
The Target Sheet allows you to set the target values for each KPI, both MTD and YTD, and track whether your organization is meeting those targets.
-
Data Entry:
Input the target values for each KPI, and compare them with actual performance in the Dashboard Sheet.
Click to buy Humanitarian Aid KPI Dashboard in Google Sheets
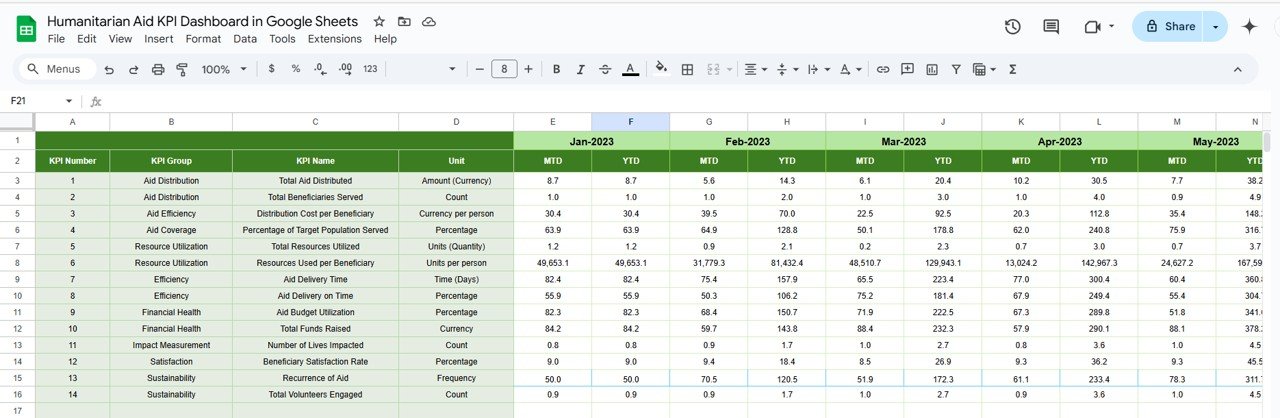
5. Previous Year Number Sheet Tab
The Previous Year Number Sheet stores data from the previous year, allowing for comparisons with the current year’s performance.
-
Data Entry:
Enter last year’s data for each KPI to track progress and assess performance improvements over time.
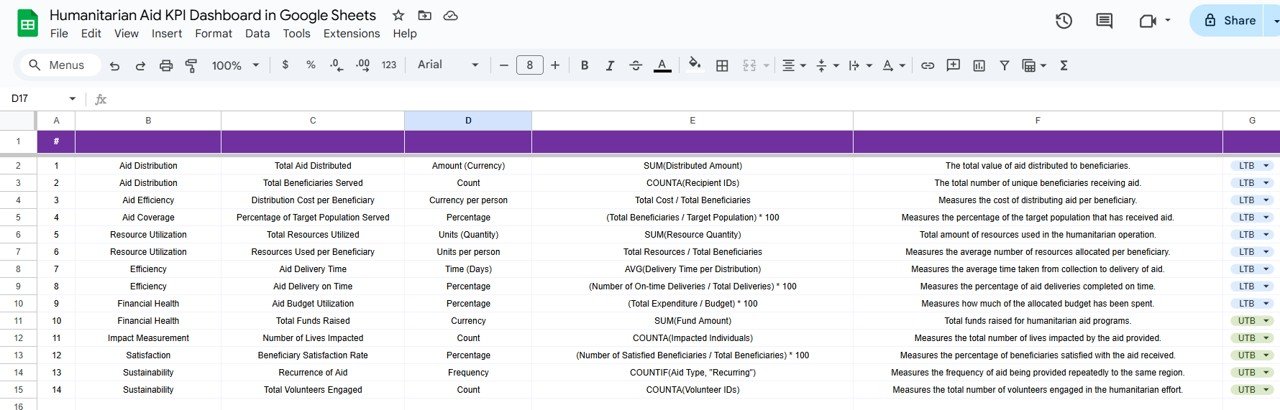
6. KPI Definition Sheet Tab
The KPI Definition Sheet contains definitions and formulas for each KPI, ensuring clarity in what each metric tracks.
-
KPI Definitions:
Each KPI is defined by its name, group, unit, formula, and a clear explanation of what it measures and how it impacts humanitarian aid operations
-
KPI Definition Sheet Tab Click to buy Humanitarian Aid KPI Dashboard in Google Sheets
Advantages of Using the Humanitarian Aid KPI Dashboard
-
Comprehensive Performance Tracking:Track all essential KPIs for your humanitarian aid programs in one centralized location, making it easier to monitor and manage your efforts.
-
Real-Time Insights:The dashboard provides real-time updates as you enter new data, ensuring that you always have the latest performance metrics available.
-
Customizable for Your Needs:This template can be easily customized to track additional KPIs, adjust formulas, or modify charts to suit your organization’s needs.
-
Data-Driven Decision Making:By tracking critical KPIs such as Donations, Beneficiaries Reached, and Volunteer Hours, the dashboard empowers you to make informed decisions that optimize your humanitarian aid programs.
-
Visual Representation:With charts and conditional formatting, the dashboard provides a clear visual representation of performance, helping you quickly identify areas of success or improvement.
Best Practices for Using the Humanitarian Aid KPI Dashboard
Click to buy Humanitarian Aid KPI Dashboard in Google Sheets
-
Update Data Regularly:Ensure that data is updated consistently so the dashboard reflects the most current performance metrics.
-
Focus on Key Metrics:Regularly monitor KPIs such as Sustainability Fund Utilization, Volunteer Hours, and SLA Compliance Rate to ensure the efficiency of your aid programs.
-
Leverage Insights for Continuous Improvement:Use the KPI Trend Sheet to analyze long-term trends and adjust your strategies to enhance the effectiveness of your humanitarian efforts.
-
Use Visual Data for Reporting:Share the charts and insights from the dashboard with stakeholders to communicate performance and make data-driven decisions.
Frequently Asked Questions (FAQs)
Click to buy Humanitarian Aid KPI Dashboard in Google Sheets
1. How do I update the Humanitarian Aid KPI Dashboard?
Simply enter actual data for each KPI in the Actual Number Sheet, and the dashboard will automatically update with the latest metrics.
2. Can I track multiple aid programs with this dashboard?
Yes, the template can be customized to track different aid programs or regions by adding new sections or columns.
3. How do I compare performance year-over-year?
Enter data from the previous year in the Previous Year Number Sheet to compare it with the current year’s data and assess progress.
Conclusion
The Humanitarian Aid KPI Dashboard in Google Sheets is a powerful tool for tracking and optimizing your aid programs. By monitoring key metrics such as Total Donations, Beneficiaries Reached, and Volunteer Hours, the dashboard provides valuable insights into your humanitarian efforts. Whether you’re a large international aid organization or a smaller, localized initiative, this dashboard helps you ensure that your resources are being used effectively and that you’re making the maximum impact on the communities you serve.
Visit our YouTube channel to learn step-by-step video tutorials
Youtube.com/@NeotechNavigators
Watch the step-by-step video Demo:
Click to buy Humanitarian Aid KPI Dashboard in Google Sheets