In today’s industrial environment, safety performance is not just a compliance metric—it’s a key measure of operational excellence. The Industrial Safety KPI Dashboard in Google Sheets provides a smart, visual, and automated way to monitor critical safety indicators such as incident rates, near misses, training compliance, and corrective actions.Industrial Safety KPI Dashboard in Google Sheets
This ready-to-use dashboard helps EHS (Environment, Health & Safety) professionals track, analyze, and improve workplace safety in real time—right inside Google Sheets.Industrial Safety KPI Dashboard in Google Sheets
What Is an Industrial Safety KPI Dashboard?
An Industrial Safety KPI Dashboard is a data-driven tool that helps organizations visualize and analyze safety-related metrics in a centralized format.Industrial Safety KPI Dashboard in Google Sheets
It simplifies safety management by allowing users to monitor key performance indicators (KPIs) like:
-
Lost Time Injury Frequency Rate (LTIFR)
-
Total Recordable Incident Rate (TRIR)
-
Near Miss Frequency Rate (NMFR)
-
Safety Training Completion %
-
Equipment Inspection Compliance %
By turning raw data into interactive visuals, organizations can identify problem areas, reduce incidents, and ensure a culture of proactive safety monitoring.
Dashboard Structure
Click to Buy Industrial Safety KPI Dashboard in Google Sheets
The dashboard includes 6 key worksheets, each serving a specific analytical purpose:
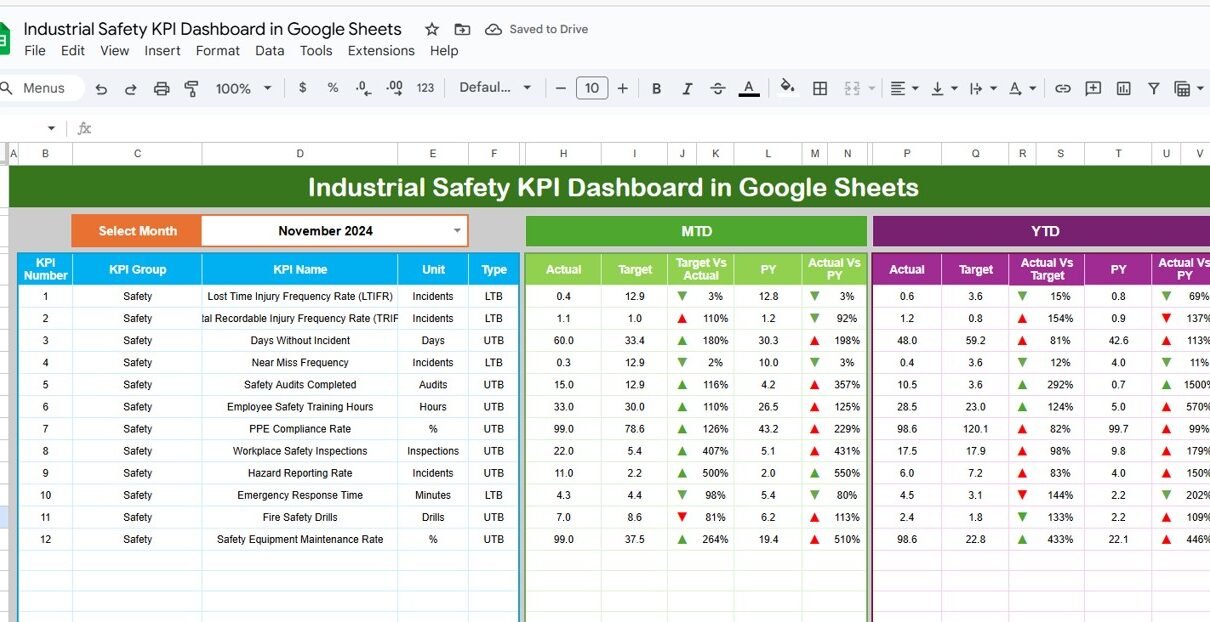
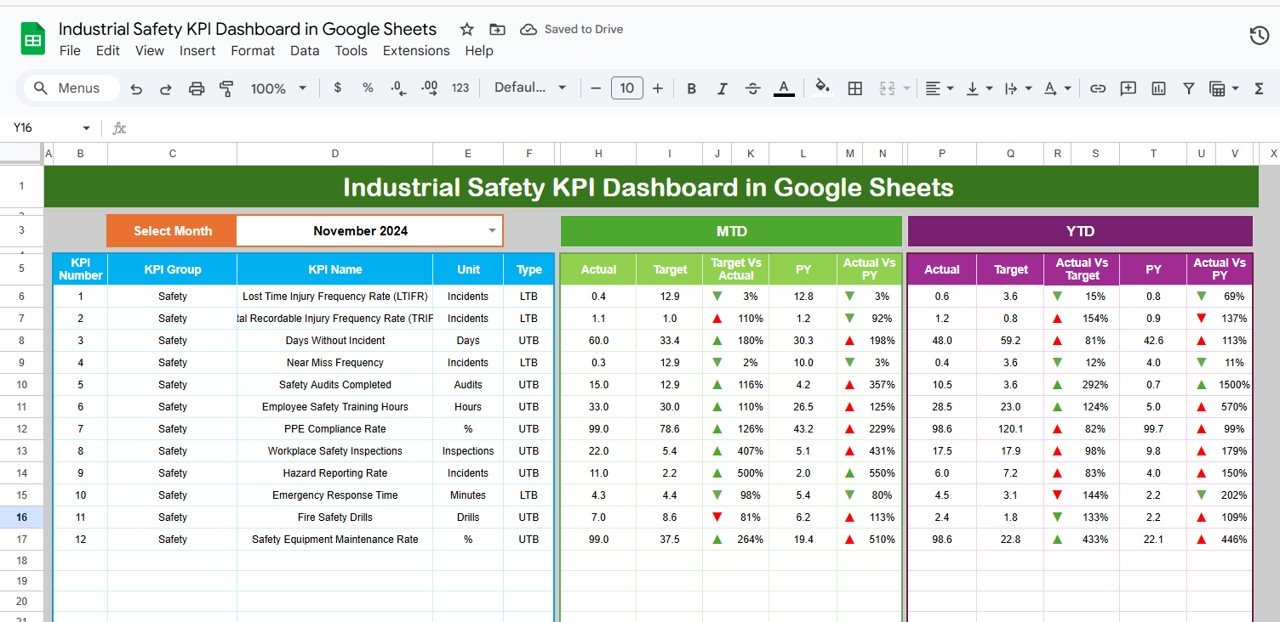
Dashboard Sheet Tab
The Dashboard Sheet is the main interface, displaying all KPI visuals, summary cards, and performance comparisons.
-
The month selector (Range D3) lets users toggle between months easily.
-
Data updates dynamically based on selected months.
-
Shows MTD (Month-to-Date) and YTD (Year-to-Date) performance for each KPI.
-
Conditional formatting applies green upward arrows (↑) for improvement and red downward arrows (↓) for underperformance.
KPI Cards Shown:
- Total Incidents
- Lost Time Injuries (LTI)
- Total Recordable Incident Rate (TRIR)
- Near Misses
- Safety Training Completion %
- Equipment Inspection Compliance %
- Average Days Since Last Incident
- Corrective Actions Closed %
- PPE Compliance %
- Lost Work Days
Click to Buy Industrial Safety KPI Dashboard in Google Sheets
KPI Trend Sheet Tab
This tab provides KPI-level trend visualization and analysis.
-
Use cell C3 dropdown to select any KPI.
-
Displays KPI Group, Unit, Type (UTB/LTB), Formula, and Definition.
-
Shows historical monthly trends for MTD and YTD comparisons.

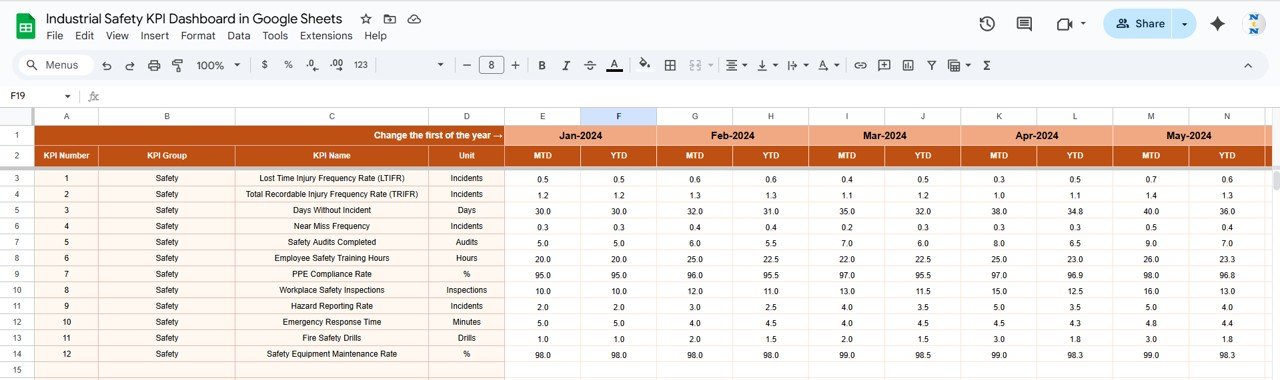
Actual Number Sheet Tab
This sheet stores monthly actual data for each KPI.
-
Update the values for each month.
-
Use cell E1 to set the reference month; all visuals refresh automatically.
Click to Buy Industrial Safety KPI Dashboard in Google Sheets
Target Sheet Tab
Enter target metrics for each KPI—both MTD and YTD—to measure performance against goals.

Previous Year Number Sheet Tab
Stores previous year’s safety performance data for year-over-year benchmarking.

Click to Buy Industrial Safety KPI Dashboard in Google Sheets
KPI Definition Sheet Tab
Contains a master list of all KPIs with their formulas, units, definitions, and whether the metric is UTB (Upper the Better) or LTB (Lower the Better).

Advantages
-
🦺 Comprehensive Safety Monitoring: Tracks all essential industrial safety KPIs in one dashboard.
-
⚙️ Automated Calculations: Eliminates manual data analysis through pre-built formulas.
-
🧠 Actionable Insights: Identify unsafe trends before they escalate into major incidents.
-
📈 Performance Benchmarking: Compare results month-to-month or year-over-year.
-
☁️ Google Sheets-Based: Enables collaboration across EHS and management teams.
Opportunities for Improvement
Click to Buy Industrial Safety KPI Dashboard in Google Sheets
-
Integrate incident reporting forms (Google Forms) for automated data input.
-
Add real-time alerts for incident thresholds using Google Apps Script.
-
Include severity-level breakdowns (Minor, Major, Critical).
-
Link training database for employee-level tracking.
-
Introduce predictive analytics to forecast safety risks.
Best Practices
-
Regularly update actual and target data.
-
Record near misses consistently to prevent future incidents.
-
Conduct monthly safety performance reviews.
-
Use standardized definitions for all safety KPIs.
-
Encourage real-time reporting and data transparency.
Conclusion
The Industrial Safety KPI Dashboard in Google Sheets empowers organizations to proactively track safety performance, reduce incidents, and improve compliance.
With automated calculations, interactive visuals, and a structured KPI framework, it helps EHS leaders ensure that safety isn’t just a priority—but a measurable performance goal.
Visit our YouTube channel to learn step-by-step video tutorials
Youtube.com/@NeotechNavigators
Watch the step-by-step video Demo:
Click to Buy Industrial Safety KPI Dashboard in Google Sheets